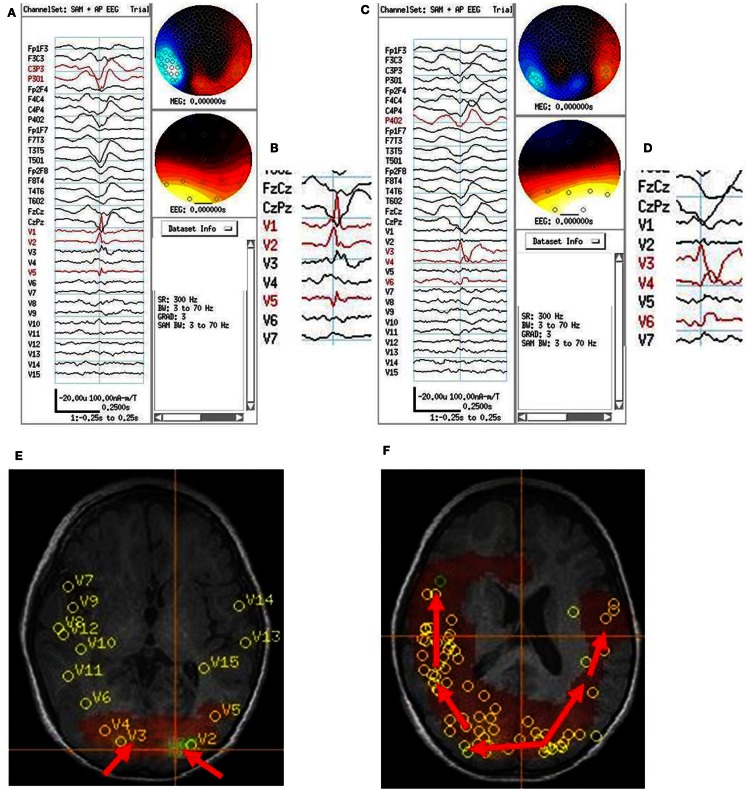
Figure 6.
Subject 6. (A) Bipolar AP EEG and fifteen virtual sensor channels showing average of 154 interictal spike epochs in bandwidth 3–70 Hz. For this averaged spike, epochs were aligned based on spike peak detected at VS location V1 in left occipital lobe in the 20–70 Hz bandwidth. (B) Inset shows close-up of VS peaks at VS locations. Although the averaged epochs shown were aligned on the timing for VS location V1, the average shows the earliest VS spike onsets were at VS locations V2 and V5 left occipitotemporal, then 13 ms later spike peak at V1, left occipital, and 13–26 ms later two peaks in V3, right occipital. (C) Bipolar AP EEG and fifteen virtual sensor channels showing average of 129 interictal spike epochs in bandwidth 3–70 Hz. For this averaged spike, epochs were aligned based on spike peak detected at VS location V3 in right occipital lobe in the 20–70 Hz bandwidth. (D) Inset shows close-up of VS peaks at VS locations. The spike peak at V3, right posterior occipital occurred earliest followed by V4 (26 ms), right anterior occipital, and V6 (39 ms), right posterior temporal. (E) Subject’s axial MRI scan showing right V3 and left V2 occipital earliest spike peak locations. (F) Subject’s 3D MRI scan showing relative timing of peak locations starting in either left or right occipital lobe and spreading anteriorly. Red arrows indicate relative timing of peaks, pointing toward later peaks.

