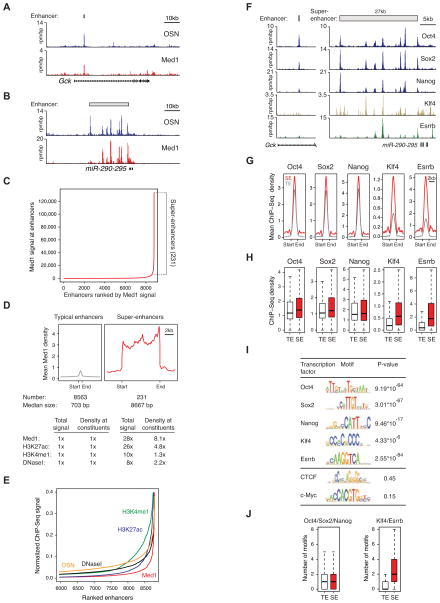
Figure 1. Enhancers and super-enhancers in ESCs.
A,B) ChIP-Seq binding profiles (reads per million per base pair) for ESC transcription factors Oct4, Sox2, and Nanog (OSN), and the Mediator coactivator (Med1) at the Gck and miR-290-295 loci in ESCs. Gene models are depicted below the binding profiles. Enhancer bars and scale bars are depicted above the binding profiles.
C) Distribution of Mediator ChIP-Seq signal (total reads) across the 8,794 ESC enhancers. Mediator occupancy is not evenly distributed across the enhancer regions, with a subset of enhancers (the 231 super-enhancers) containing exceptionally high amounts of Mediator.
D) Metagenes of Mediator ChIP-Seq density (reads per million per base pair) across the 8,563 typical enhancers and the 231 super-enhancers. Metagenes are centered on the enhancer region (703 base pairs for typical enhancers and 8.7kb for super-enhancers), with 3kb surrounding each enhancer region. ChIP-Seq fold difference for enhancer features Mediator, H3K27ac, H3K4me1, and DNaseI hypersensitivity at super-enhancers versus typical enhancers are displayed below the metagenes. Fold difference at enhancers refers to the mean ChIP-Seq signal (total reads) at super-enhancers divided by the mean ChIP-Seq signal at typical enhancers. Fold difference at enhancer constituents refers to the mean ChIP-Seq density (reads per million per base pair) at super-enhancer constituents divided by the mean ChIP-Seq density at typical enhancer constituents. See also Figure S1A and Data S1.
E) Distribution of Mediator, H3K27ac, H3K4me1, DNaseI hypersensitivity, and OSN normalized ChIP-Seq signal across a subset of the 8,794 ESC enhancers. For each enhancer feature, the plot was normalized by dividing the ChIP-Seq signal at each ESC enhancer by the maximum ChIP-Seq signal. The enhancers on the X-axis are ranked for each enhancer feature independently (i.e., the exact enhancer at position 8000 is different for each enhancer feature). The x- and y-axes are adjusted so that the differences in the distribution of each of the enhancer features can be visualized. See also Figure S1B.
F) ChIP-Seq binding profiles for Oct4, Sox2, Nanog, Klf4, and Esrrb at the Gck and miR-290-295 loci in ESCs.
G) Metagenes of Oct4, Sox2, Nanog, Klf4 and Esrrb ChIP-Seq density across the constituent enhancers within the 8,563 typical enhancers and the 231 super-enhancer regions. Each metagene is centered on a constituent enhancer with 2kb surrounding the constituent enhancer region.
H) Box plots of Oct4, Sox2, Nanog, Klf4 and Esrrb ChIP-Seq density at constituent enhancers within the 8,563 typical enhancers and the 231 super-enhancers. P-values (Oct4= 0.012, Nanog= 10−4, Sox2= 0.11, Klf4= 10−34, Esrrb= 10−25) were calculated using a two-tailed t-test.
I) Table depicting transcription factor binding motifs enriched at constituent enhancers within super-enhancer regions relative to genomic background, and associated p-values. CTCF and c-Myc are not enriched.
J) Left panel, Box plot depicting the number of Oct4, Sox2, or Nanog binding motifs at constituent enhancers within typical enhancers and constituent enhancers within super-enhancers. Right panel, Box plot depicting the number of Klf4 or Esrrb binding motifs at constituent enhancers within typical enhancers and constituent enhancers within super-enhancer regions. P-values (Oct4/Sox2/Nanog= 0.36, Klf4/Esrrb= 10−45) were calculated using a two-tailed t-test.

