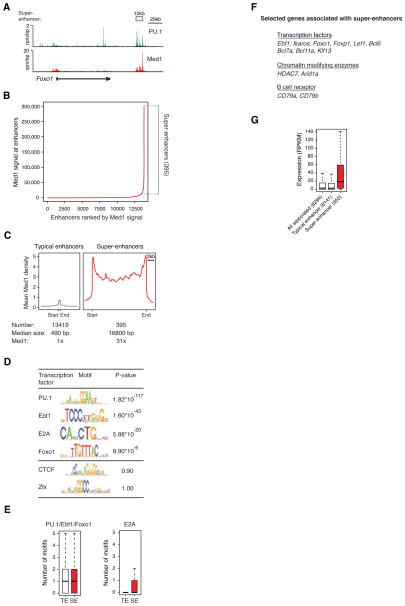
Figure 4. Super-enhancers in pro-B cells.
A) ChIP-Seq binding profiles for PU.1, and Med1 at the Foxo1 locus in pro-B cells.
B) Distribution of Mediator ChIP-Seq density across the 13,814 pro-B enhancers, with a subset of enhancers (the 395 super-enhancers) containing exceptionally high amounts of Mediator. See also Figure S4.
C) Metagenes of Mediator density across the typical and super-enhancers in proB cells. Metagenes are centered on the enhancer region (422 base pairs for typical enhancers, and 15.4kb for super-enhancers), with 3kb surrounding each enhancer region. ChIP-Seq fold difference for Mediator at super-enhancers versus typical enhancers is displayed below the metagenes.
D) Table depicting transcription factor binding motifs enriched at constituent enhancers within super-enhancer regions relative to genomic background and associated p-values. CTCF and Zfx are not enriched.
E) Left panel, Box plot depicting the number of PU.1, Ebf1 or Foxo1 binding motifs at constituent enhancers within typical enhancers and constituent enhancers within super-enhancers. Right panel, Box plot depicting the number of E2A binding motifs at constituent enhancers within typical enhancers and constituent enhancers within super-enhancer regions. P-values (PU.1/Ebf1/Foxo1= 10−5, E2A= 10−22) were calculated using a two-tailed t-test.
F) List of selected genes associated with super-enhancers and playing prominent roles in B cell biology.
G) Box plots of expression from typical enhancer-, super-enhancer-, and all enhancer-associated genes in pro-B cells. The number of genes belonging to each category for which we have expression data is denoted. P-value (10−6) was calculated using a two-tailed t-test.

