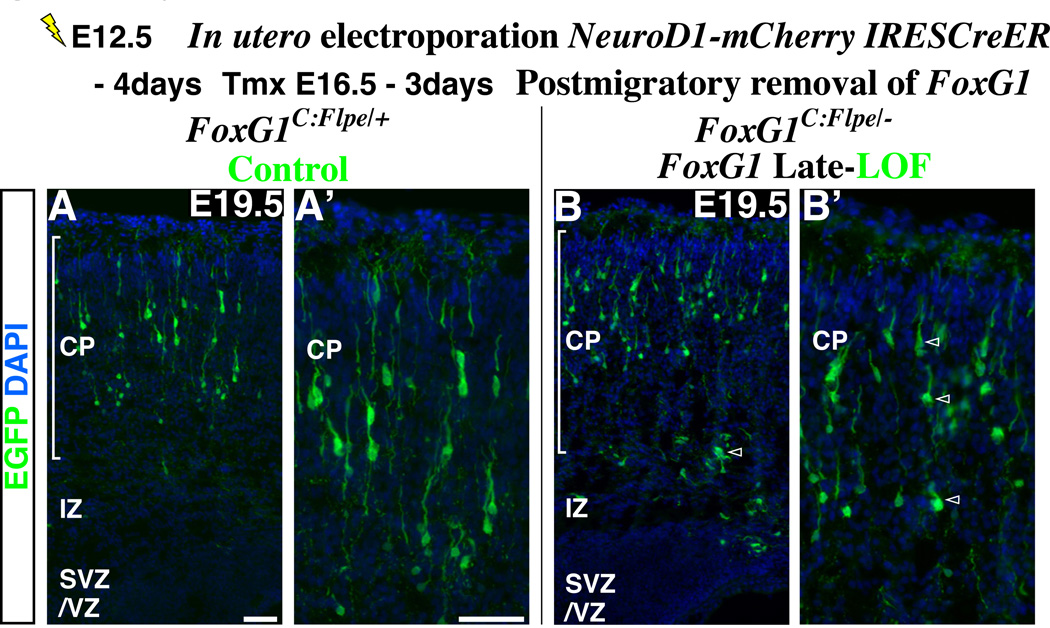
Figure 5. The role of FoxG1 in the multipolar cells is distinct from its function in postmigratory neurons within the cortical plate.
In order to remove FoxG1 in postmigratory pyramidal neuron precursors inside the cortical plate, we have introduced a pNeuroD1-mCherry-IRES CreER vector into the ventricular zone by in utero electroporation at E12.5. This manipulation allows us to simultaneously visualize the morphologies of postmitotic cells through their expression of mCherry, as well as enabling us to recombine the conditional FoxG1 loss-of-function allele at a desired time point. As the FoxG1 loss-of-function allele expresses Flpe after gene removal (A scheme in Figure 4A), FoxG1 mutant cells can be visualized with EGFP directed from the Flpe-activated reporter line (R26R-CAG-FRTstop-EGFP) (Miyoshi et al., 2010). At E16.5, a time by which the majority of cells electroporated at E12.5 have completed migration and settled inside the cortical plate (data not shown), tamoxifen administration was carried out to remove FoxG1 in these cells. These embryos were analyzed at E19.5. (A, high magnification in A’) The control experiment was carried out in the FoxG1-C:Flpe/+ background. Pyramidal neurons labeled by EGFP are heterozygous for FoxG1. (B, B’) The loss-of-function experiment was carried out in the FoxG1-C:Flpe/− background. Note that control and FoxG1-null cells have pyramidal morphologies and occupy similar positions within the cortex. In addition, removal of FoxG1 gene function in postmigratory cells did not result in up-regulation of NeuroD1 and Unc5D (data not shown). Although the dendritic branching of mutant pyramidal neurons appears somewhat retarded compared to the control population (A, A’), they are not different from the internal control cells (Supplemental Figure S6D’, red without green cells, arrowheads). Most importantly, these cells do not morphologically or molecularly resemble the multipolar population. Note that for the purpose of presentation, cells labeled red by mCherry are not visualized in these panels. For the mCherry expression and also for the detailed comparison of wild type, heterozygous and null cells for FoxG1 in both FoxG1C:Flpe/+ and FoxG1C:Flpe/− backgrounds, see Supplemental Figures S6C and S6D.
Scale bars: 50µm

