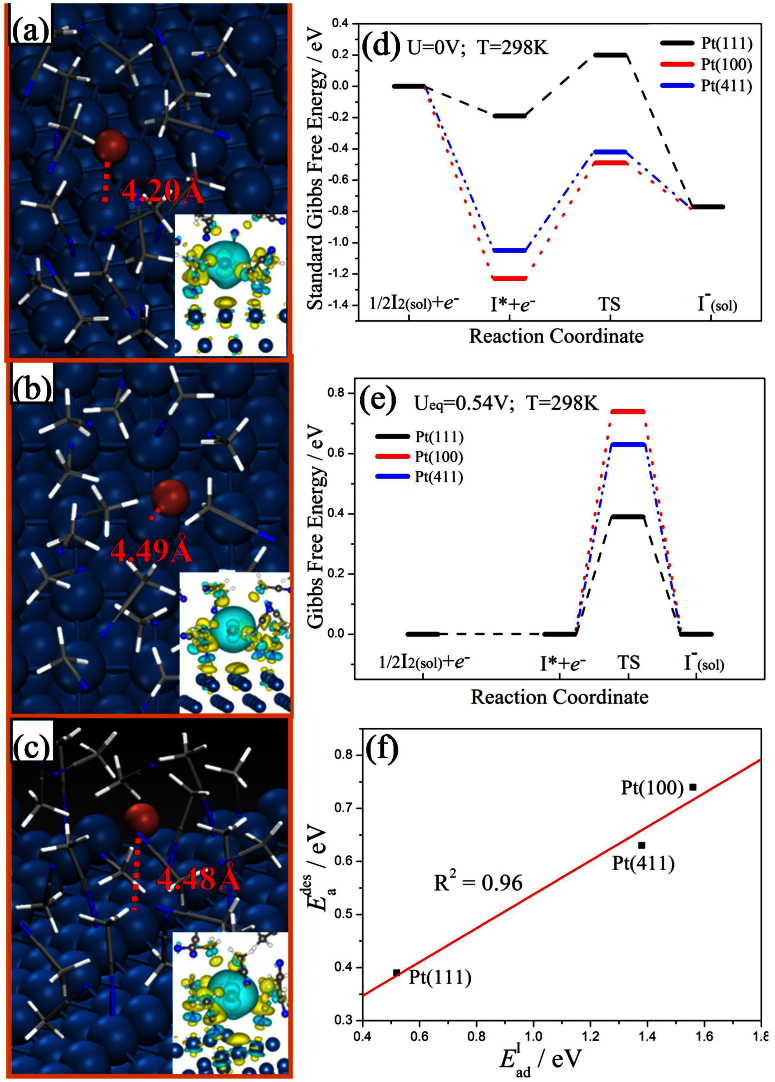
Figure 1. Transition state structures at CH3CN/Pt(111), CH3CN/Pt (100), and CH3CN/Pt(411) interfaces, respectively, as well as Energy profiles of the whole counter electrode reaction.
(a), transition state structure on Pt(111) surface in the presence of CH3CN solvent. Inserts: charge density difference map of TS, and light-blue color represents for electron accumulation while yellow for electron depletion. (b–c) are for the Pt(100) and Pt(411) surface, similar with (a). (d), Standard Gibbs free energy profiles of IRR on Pt(111), Pt(100), Pt(411), respectively. (e), Gibbs free energy profiles of IRR on Pt(111), Pt(100), Pt(411), respectively, under the I3−/I− equilibrium voltage of 0.54 V. (f), the linear relationship between I* desorption barrier (Eades) and adsorption energy (EadI).

