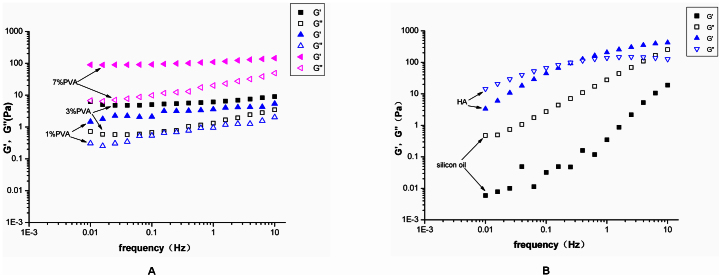
Figure 1.
(A) The storage modulus G′ and the loss modulus G″ were plotted logarithmically against frequency (0.01–10 Hz at 37°C) for the 1% PVA, 3% PVA, and 7% PVA hydrogels. (B) The storage modulus G′ and the loss modulus G″ were plotted logarithmically against frequency (0.01–10 Hz at 37°C) for the silicon oil and HA.

