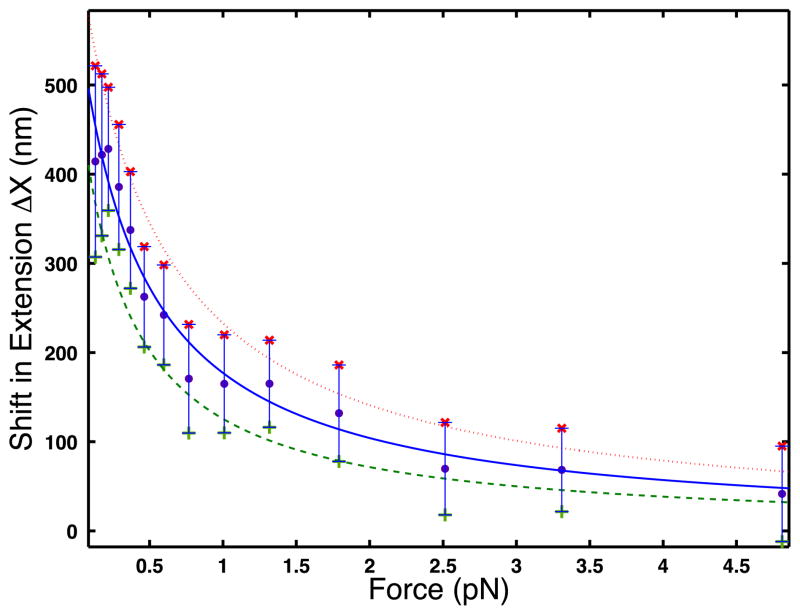
Figure 3.
Shift in DNA extension ΔX versus force. The error bars are the sum of the standard deviations of the extension measurements at each concentration, divided by the square root of the number of measurements, which is 10. The continuous curves are the best least squares fit to the data using the analytic function of the form a/(1 + bx). The solid line shows the best fit to the experimental data (circles), the dotted curve shows the best fit to the upper bound of the data (× symbols), and the dashed curve is the best fit to the lower bound of the data (+ symbols).

