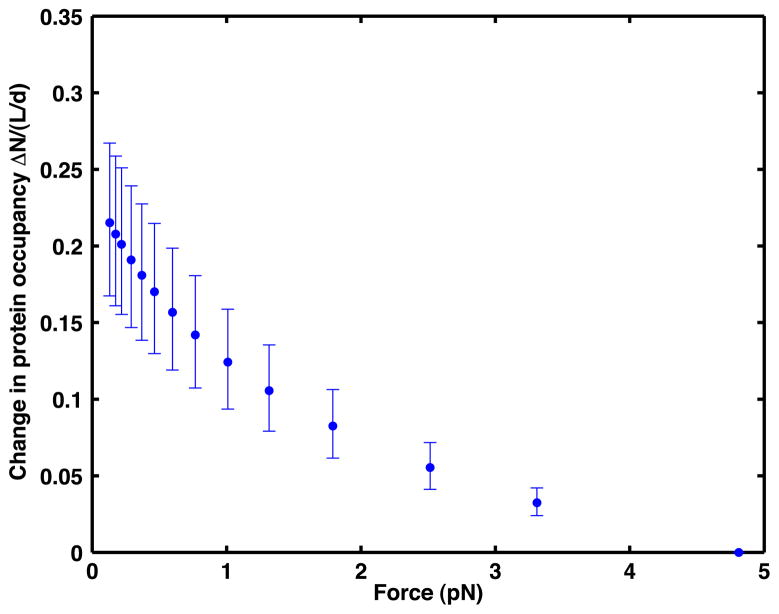
Figure 4.
The change ΔN/(L/d) in protein occupancy for DNA at 170 nM CI as the force reduces from 4.81 to 0.13 pN. Here, L is the length of the DNA molecule and d is the length of a single binding site. The blue dots represent the change as estimated using the average data points and are shown along with their error bars defined by upper and lower bound values.

