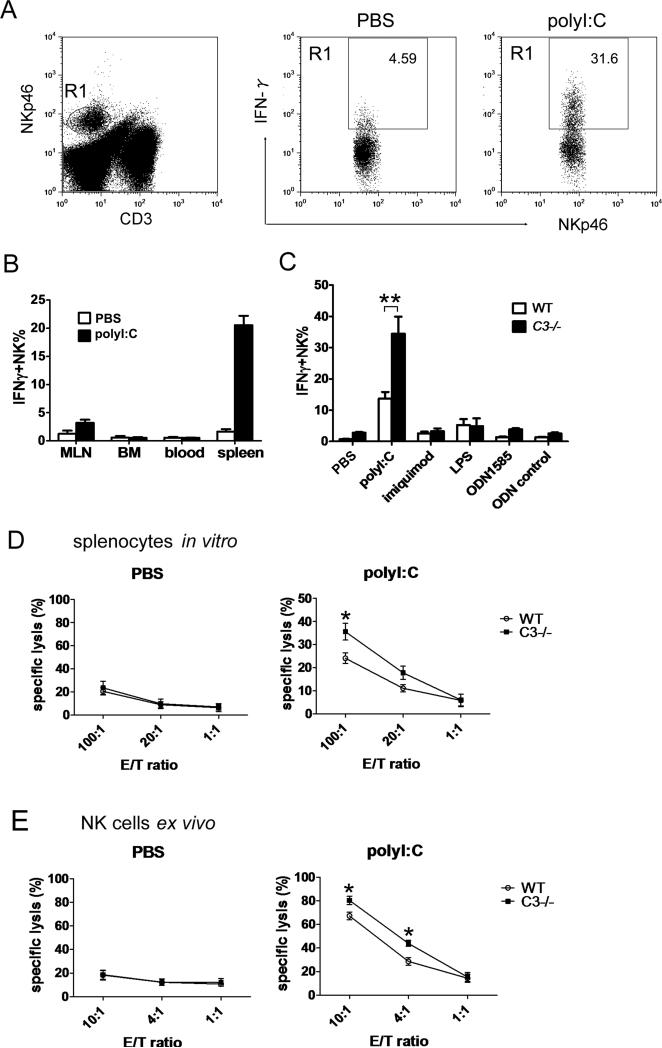
Figure 1.
Increased NK-cell activation in C3–/– mice in response to polyI:C. (A) Gating strategy. NK cells were gated as NKp46+CD3- cells (R1), and the percentage of IFN-γ+ NK cells was calculated by dividing IFN-γ+NK cells against total NK cells in the presence/absence of polyI:C stimulation. (B) MLNs, BM, blood and spleen cells were stimulated with polyI:C for 5 hours. The percentage of IFN-γ+ cells in NK cell population was analyzed by flow cytometry as in (A). Data are mean + S.D. n=5 mice per group and reprentative of 3 independent experiments. (C) Splenocytes from C3–/– or WT mice were stimulated with the indicated TLR agonists and the percentage of IFN-γ+ NK cells were determined. Data are mean ± SEM n=6 mice/group and reprentative of 3 independent experiments. (D) WT or C3–/– splenocytes were stimulated with polyI:C or left unstimulated before incubation with CFSE-label YAC-1 cells and lysis of YAC-1 cells was measured. E/T ratio: effector / target cell ratio. Data are means ± SD and are representative of 5 independent experiments each with n=3/group. (E) C3–/– or WT mice were i.p. injected with 100 μg polyI:C or PBS. Splenic NK cells were purified for cytotoxic assay against YAC-1 cells 24 hours later. Data are mean ± SEM n=6 mice/group and are representative of two independent experiments. * P<0.05, ** P<0.02 (Student t test).

