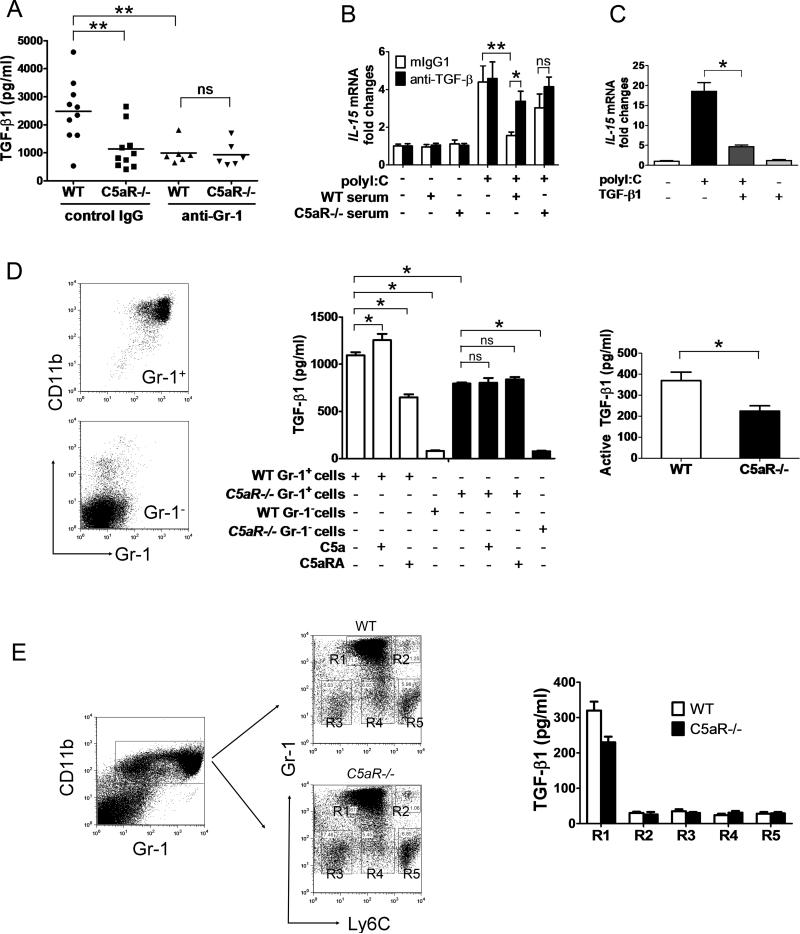
Figure 4.
Modulation of cDC activity by C5a-induced TGF-β1 in Gr-1+ myeloid cells. (A) WT and C5aR–/– mice were injected with anti-Gr-1 or isotype control mAb. Plasma TGF-β1 levels were tested 2 days later. Each symbol represents data from an individual mouse and the horizontal bar represents the mean; n=6-10 mice/group. Data are representative of 2 independent experiments. Student t test ** P<0.02 (/Student t test). (B, C) Splenic cDCs (B) were pre-incubated with 10% of WT or C5aR–/– serum in the presence or absence of an anti-TGF-β1 mAb, or (C) were pre-treated with 10 ng/ml of TGF-β1 for 16 hr, then stimulated with polyI:C. IL-15 expression was measured by real-time PCR. (D) BM Gr-1+CD11b+ and Gr-1- cells isolated from WT or C5aR–/– mice were cultured with or without C5a (0.5 μg/ml) or C5aRA (250 nM) in serum-free OPT-MEM medium for 6 hours. Total (middle) and active (right) TGF-β1 production in the culture supernatant was measured by ELISA. (E) BM cells were sorted based on CD11b, Gr-1 and Ly6C expression. TGF-β1 was measured in the culture supernatant of sorted cells by ELISA. (B-E) Data are either representative (plots) or mean + SD (graphs) of n=3-5/mice per group and are representative of 4-6 independent experiments. * P<0.05, ** P<0.02 (Student t test).

