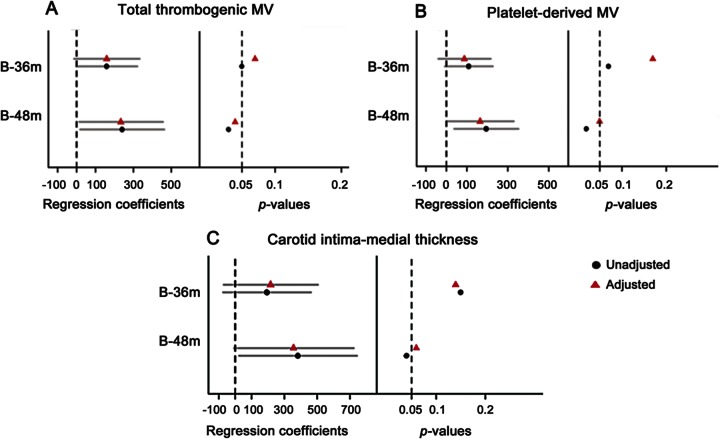
Figure 3. Associations between white matter hyperintensity change and platelet-derived microvesicles and carotid intima-medial thickness.
Total thrombogenic (annexin V–positive) microvesicles (MV) (A), platelet-derived (CD42a-positive) MV (B), carotid intima-medial thickness (CIMT) (C), and regression coefficients of total white matter hyperintensity (WMH) volume change, in cubic millimeters, at the 95% confidence interval at 36 and 48 months. The dotted line on the left panel is set at 0 and represents the estimated mean of total WMH change. The right panel represents p values at p = 0.05 significance level. Circles represent results from unadjusted and triangles represent results from adjusted (age, time in months past menopause, and APOE ε4 status) linear regression models. B = baseline; m = months.

