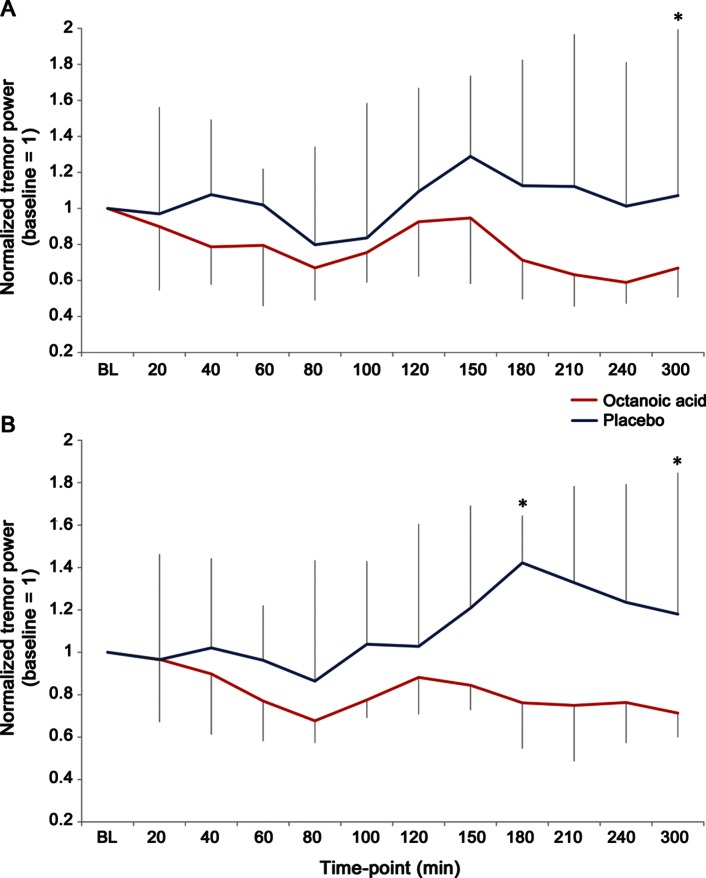
Figure 3. Octanoic acid effect on tremor power up to 300 minutes after administration.
Normalized tremor power of postural hand tremor at the spectral tremor frequency peak, measured with weighted accelerometry, across time points up to 300 minutes after administration, shown (A) for the dominant hand and (B) both hands. Because individual time-point data were not normally distributed, plot shows median and interquartile range. X-axes represent normalized tremor power (baseline = 1); values >1 represent larger tremor power, <1 reduction in tremor power; *time points with significant differences between octanoic acid and placebo (p < 0.05).

