
Figure 2. Relating the inverted U-shaped amyloid rates as a function of baseline standardized uptake values to sigmoid-shaped trajectory of amyloid accumulation with time.
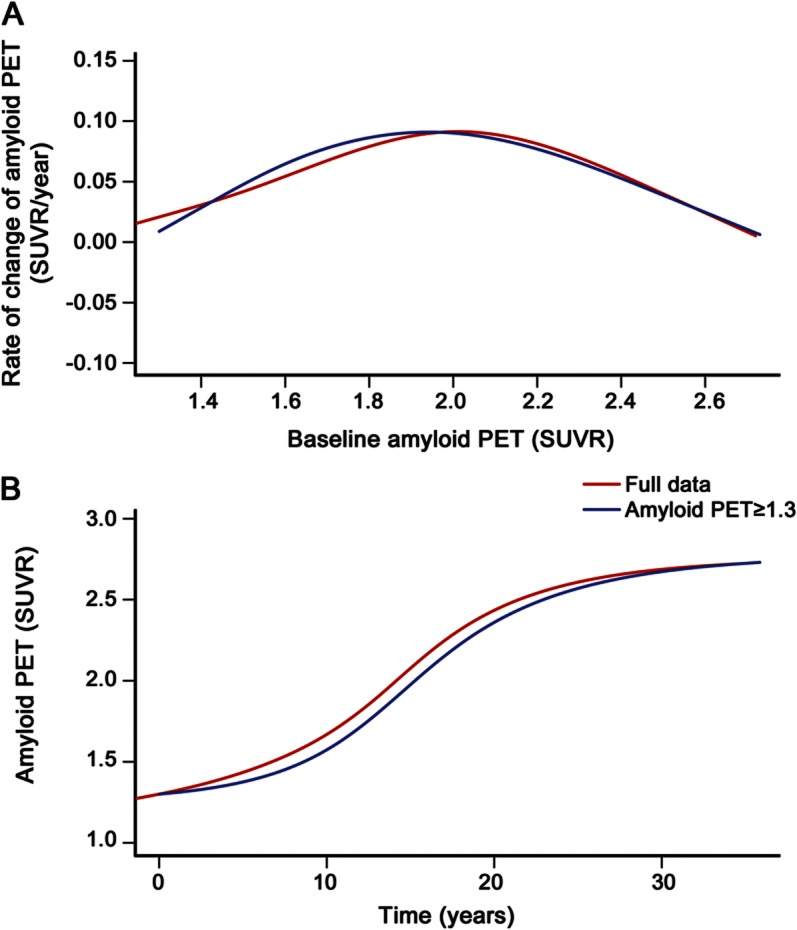
(A) The rate of amyloid accumulation per year as a function of baseline amyloid load in standardized uptake value (SUVR) units. The red plot in A is the same as the plot in figure 1, except for the upper bound truncation (see below). (B) The integral with respect to time of the data in (A) which models amyloid level in SUVR units as a function of increasing time in years. These plots are provided for all participants (n = 260, in red) and for only those participants whose baseline amyloid PET was 1.3 SUVR or greater (n = 212, in blue). For both the lower truncated (at 1.3 SUVR) and nontruncated analyses, the upper SUVR in the model was truncated at 2.7.