
Figure 3. Estimates of time required to travel from a baseline amyloid PET load of 1.5 standardized uptake values to greater values.
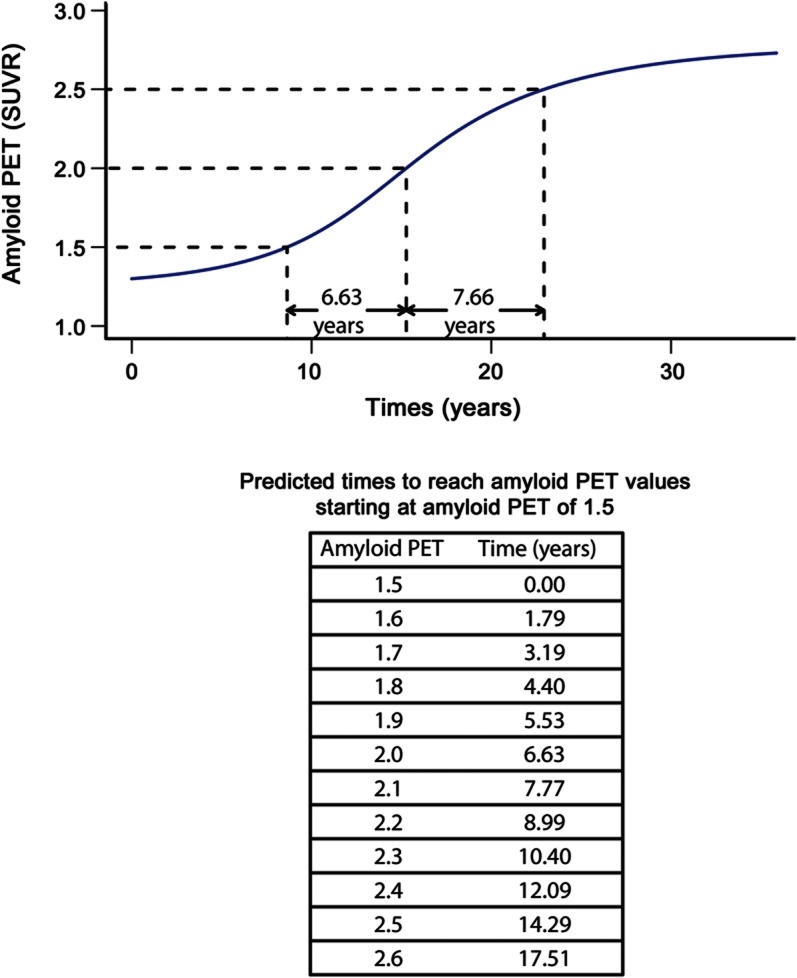
This is illustrated in the plot of amyloid PET load vs time in participants whose baseline standardized uptake value (SUVR) was greater than or equal to 1.3 (n = 212, in blue from figure 2B).