
Figure 4. Within-subject trajectories of amyloid PET standardized uptake values by age for all subjects (n = 260).
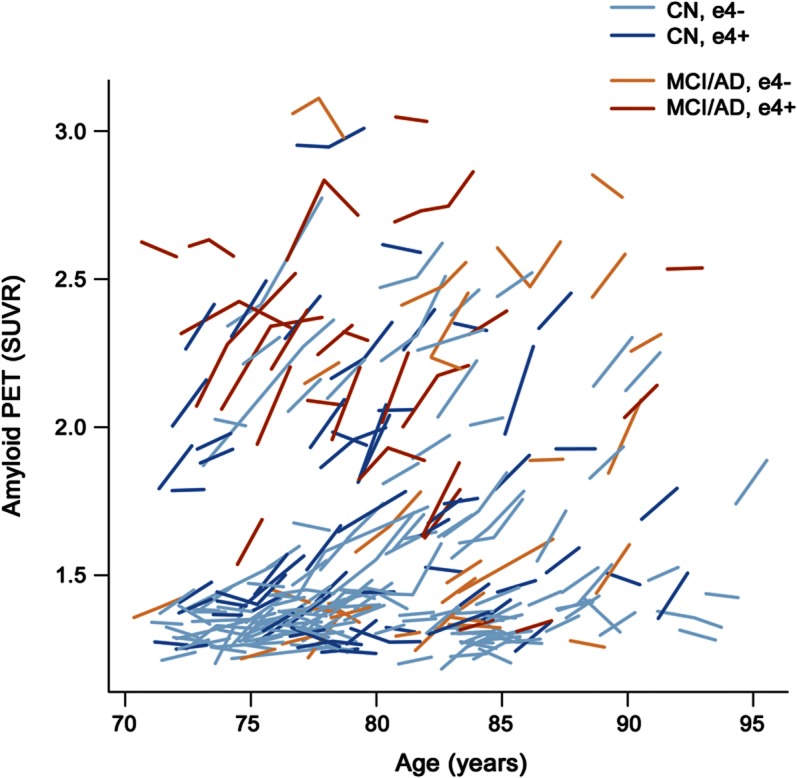
Cognitively normal (CN) participants are represented by blue lines and impaired participants by orange lines. Lighter colored lines represent APOE ε4− participants and darker colors represent APOE ε4+ participants. AD = Alzheimer disease; MCI = mild cognitive impairment.