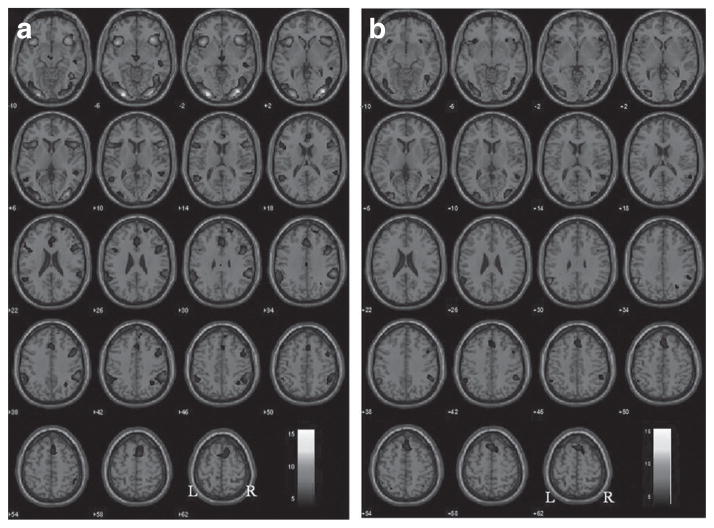
Figure 1.
Brain regions showing activation in stop as compared to go trials for (a) lean and (b) obese subjects (P < 0.001, uncorrected). Blood oxygenation level dependent contrasts are superimposed on a T1 structural image in axial sections from z = −10 to z = 62. The adjacent sections are 4 mm apart. The color bar represents voxel T value. Neurological orientation: right = right.

