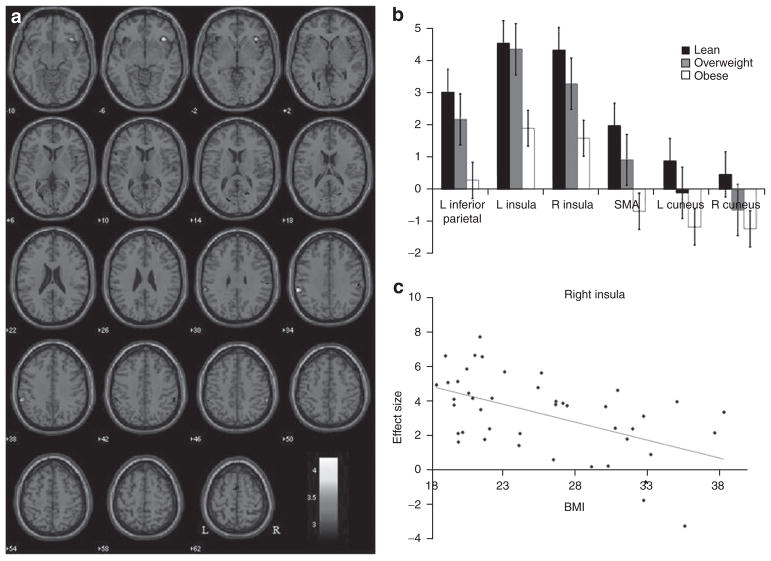
Figure 2.
Lean women show greater activations than obese women during stop as compared to go trials. (a) Brain regions showing more activation in stop as compared to go trials for lean as compared to obese subjects (P < 0.005, uncorrected). Blood oxygenation level dependent contrasts are superimposed on a T1 structural image in axial sections from z = −10 to z = 62. The adjacent sections are 4 mm apart. The color bar represents voxel T value. Neurological orientation: right = right. (b) Histograms showing the effect sizes of activations in regions of interests for lean, overweight, and obese subjects. (c) The effect sizes for right insula activation during saliency processing showed the most significant linear correlation to BMI across all subjects (r = −0.5127, P < 0.0004).

