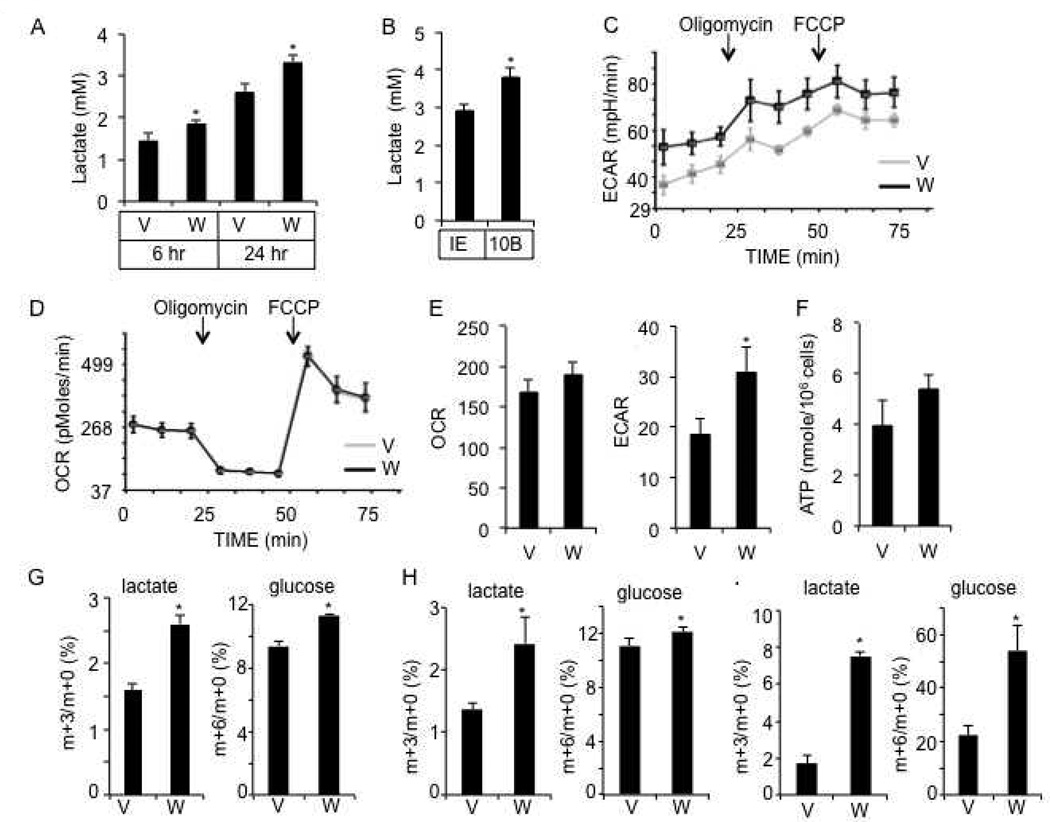
Figure 2. WNT3A stimulates aerobic glycolysis in ST2 cells.
(A) Media lactate levels following vehicle (V) or WNT3A (W) treatments. (B) Media lactate levels following viral expression of GFP (IE) or WNT10B for 24 hours. (C–D) Extracellular acidification rate (ECAR) (C) and oxygen consumption rate (OCR) (D) after 6 hours of WNT3A (W) or vehicle (V) treatment. (E) Measurements of ECAR and OCR after 24 hours of treatment. (F) Intracellular ATP levels after 24 hours of treatment. (G–I) Isotopomer enrichment of [U-13C3]-lactate and [U-13C6]-glucose in cell lysates after 6 (G), 12 (H) or 24 (I) hours of WNT3A (W) or vehicle (V) treatment. *: n=3, p<0.05. Error bars: STDEV.

