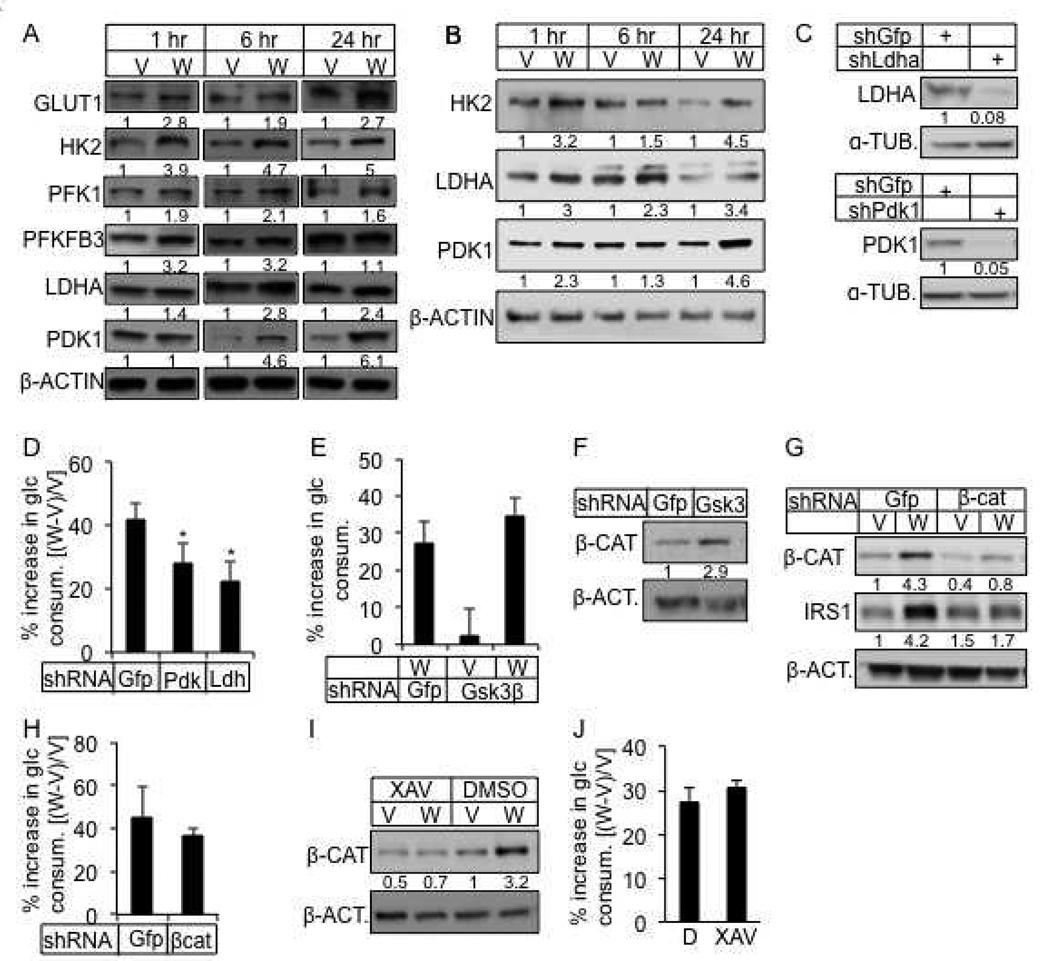
Figure 3. WNT3A induces glycolysis independent of GSK3β and β-catenin.
(A, B) Representative Western blots of glycolytic regulators in ST2 cells treated with WNT3A or vehicle in the presence (A) or absence of serum (B) for indicated times. Cells in B starved for serum for 12 hours before treatment. Protein abundance normalized to β-ACTIN. (C) Knockdown of LDHA or PDK1. shGfp as negative control. Protein abundance normalized to α-TUBULIN. (D) Effect of LDHA or PDK1 knockdown on WNT3A-induced glucose consumption. (E) Effect of GSK3β knockdown on WNT3A-induced glucose consumption. Increase in glucose consumption as % over cells treated with shGfp and vehicle. (F) Effect of GSK3β knockdown on β-catenin. (G) Knockdown of β-catenin and its effect on IRS1. (H) Effect of β-catenin knockdown on WNT3A-induced glucose consumption. (I, J) Effect of XAV-939 on β-catenin (I) and WNT3A-induced glucose consumption (J). All glucose consumption measured after 24 hours of WNT3A or vehicle treatment. D: DMSO; W: WNT3A; V: vehicle. *: n=3, p<0.05. Error bars: STDEV.

