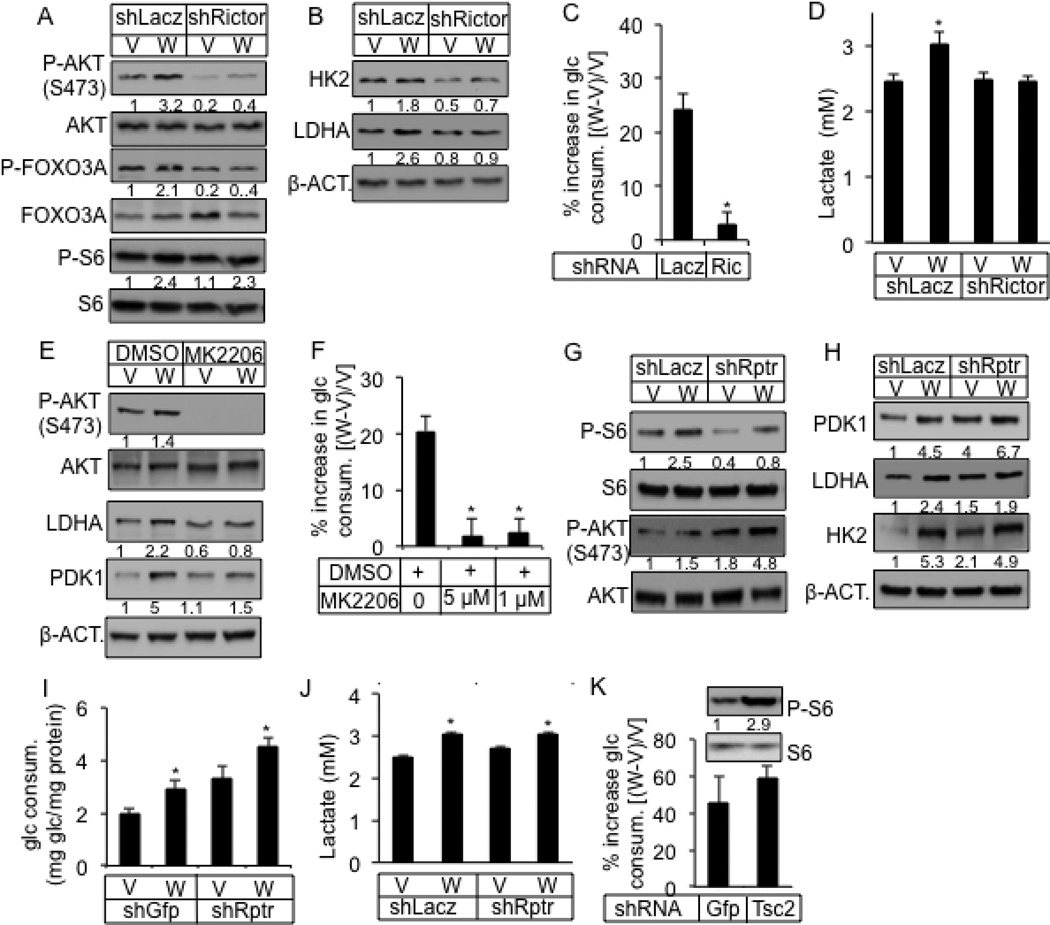
Figure 5. WNT3A induces glucose consumption via mTORC2 activation.
(A–D) Effect of RICTOR knockdown (shRictor) on mTORC1 versus mTORC2 (A), glycolytic enzymes (B), glucose consumption (C) and lactate production (D) after 24 hours of WNT3A (W) or vehicle (V) treatment. (E, F) Effect of AKT inhibitor MK2206 on glycolytic enzymes (E) and glucose consumption (F) after 24 hours of WNT3A (W) or vehicle (V) treatment. (G–J) Effect of RAPTOR knockdown (ShRptr) on mTORC1 versus mTORC2 (G), glycolytic enzymes (H), glucose consumption (I) and lactate production (J) after 24 hours of WNT3A (W) or vehicle (V) treatment. (K) Effect of TSC2 knockdown (ShTSC2) on mTORC1 and glucose consumption after 24 hours of treatment. shGFP or shLacz as negative control. *: n=3, p<0.05. Error bars: STDEV.

