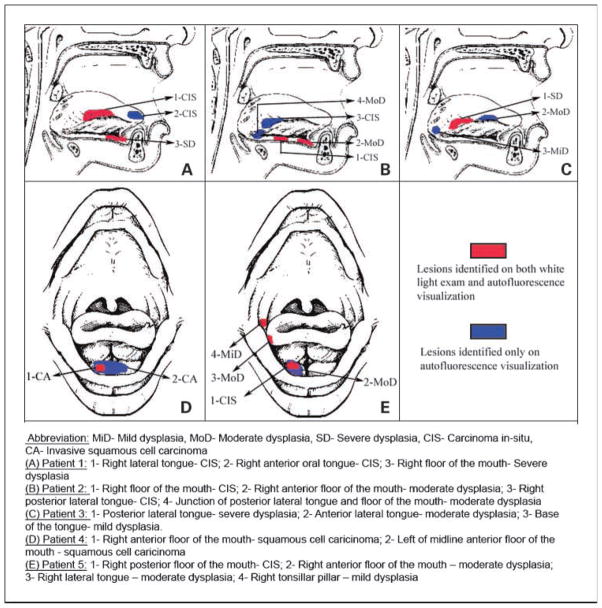
Fig. 4.
Diagram depicting the field changes identified by WLE and AFV on five high-risk patients who participated in the surveillance study. MiD, mild dysplasia; MoD, moderate dysplasia; SD, severe dysplasia; CA, invasive squamous cell carcinoma. A, patient 1: 1, right lateral tongue—CIS; 2, right anterior oral tongue—CIS; 3, right floor of the mouth—severe dysplasia. B, patient 2: 1, right floor of the mouth—CIS; 2, right anterior floor of the mouth—moderate dysplasia; 3, right posterior lateral tongue—CIS; 4, junction of posterior lateral tongue and floor of the mouth—moderate dysplasia. C, patient 3: 1, posterior lateral tongue—severe dysplasia; 2, anterior lateral tongue—moderate dysplasia; 3, base of the tongue—mild dysplasia. D, patient 4: 1, right anterior floor of the mouth—squamous cell carcinoma; 2, left of midline anterior floor of the mouth—squamous cell carcinoma. E, patient 5: 1, right posterior floor of the mouth—CIS; 2, right anterior floor of the mouth—moderate dysplasia; 3, right lateral tongue—moderate dysplasia; 4, right tonsillar pillar—mild dysplasia.

