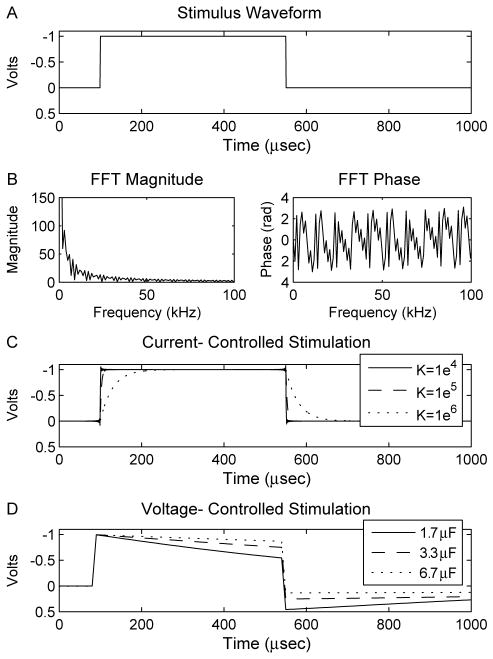
Fig. 1.
Fourier FEM method. (A) The stimulus waveform was created in the time domain and (B) subsequently converted to the frequency domain (magnitude and phase shown) using a discrete Fourier transform. The voltage waveform within the volume during (C) current-controlled stimulation and (D) voltage-controlled stimulation was calculated from the Fourier FEM solver. The differences between the original and Fourier FEM waveforms were dependent on pulse width and capacitance values.

