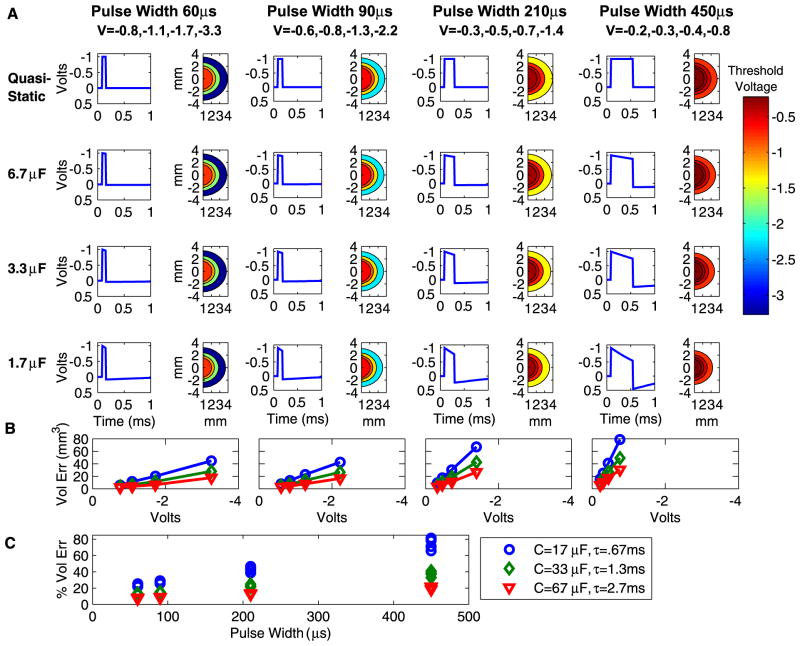
Fig. 4.
VTA resulting from voltage-controlled monopolar stimulation. (A) Results are organized by capacitance values (rows) and pulse width (columns). Within each combination of capacitance and pulse width values are a pair of graphs. The graph on the left shows the time-dependent voltage waveform as calculated by the Fourier FEM solver at one representative point in the volume. The graph on the right is a spatial filled contour plot of the extent of the VTA as determined by threshold voltage values, which correspond to the scale at right. (B) The amount in cubic millimeter by which the electrostatic model overstates the VTA compared to each capacitance value. Results are shown as a function of stimulation voltage, where voltage values are consistent within each pulse width for the graphs in (A) and (B) as indicated by the column heading labels in (A). C) Percent by which electrostatic model overstates VTA as a function of pulse width for voltage-controlled stimulation. Results are shown for different capacitance values with corresponding system time constants. Parts (B) and (C) share the legend.

