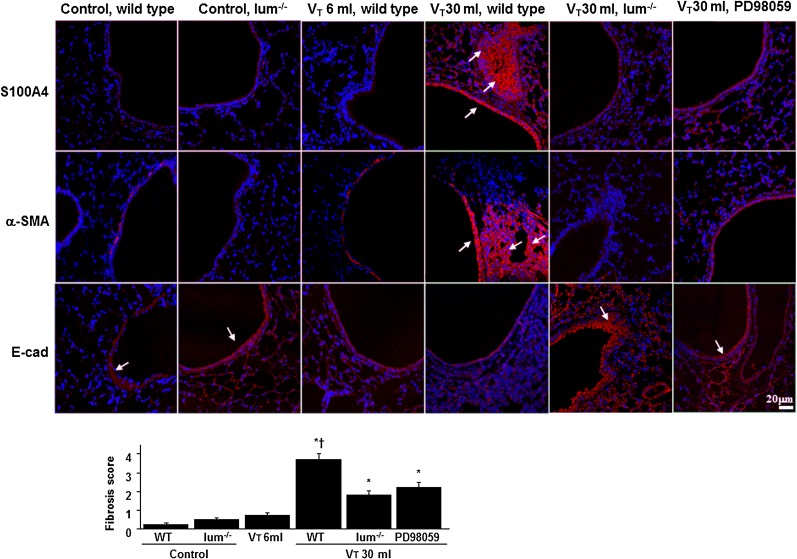
Figure 3.
Lum−/− mice and PD98059 reduced lung stretch-induced fibrogenic biomarkers. Representative photomicrographs (magnification × 400) with S100A4 (red), α-SMA (red), E-cad (red), and Hoechst (blue) immunofluorescent labeling of paraffin lung sections were from nonventilated control mice and mice ventilated at Vt 6 mL/kg or Vt 30 mL/kg for 8 h with room air (n = 5 per group). PD98059 2 mg/kg was given subcutaneously 30 min before ventilation. Positive red staining in the lung epithelium and interstitium is identified by arrows (n = 5 per group). The fibrotic scoring was quantified as the average number of 10 nonoverlapping fields in Masson trichrome staining of paraffin lung sections (bar graph, n = 5 per group). *P < .05 vs nonventilated control mice; †P < .05 vs all other groups. α-SMA = α-smooth muscle actin; E-cad = E-cadherin. See Figure 1 legend for expansion of other abbreviations.

