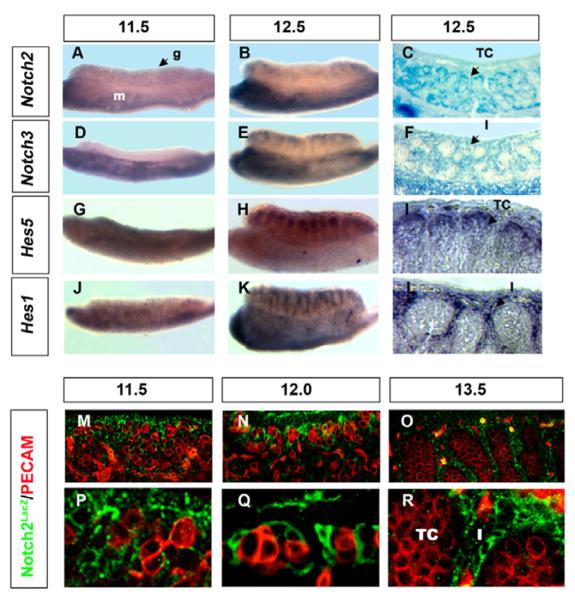
Fig. 1. Dynamic expression of the Notch signaling pathway suggests a role in mouse gonad development.
The coelomic domain of the gonad is upwards, anterior is leftwards and posterior is rightwards. Whole mount in situ hybridization of Notch2 (A,B), Notch3 (D,E), Hes5 (G,H) and Hes1 (J,K) were performed on 11.5 and 12.5 dpc XY whole gonads, and in some cases, stained gonads were sectioned (I,L). Whole-mount β-gal staining was performed on 12.5 dpc XY Notch2LacZ (C) and Notch3LacZ (F) gonads prior to sectioning. (M–R) XY Notch2LacZ gonads were stained with antibodies against β-gal (green) to detect Notch2, and PECAM1 (red, germ cells and vasculature) at 11.5, 12.0 and 13.5 dpc. Low (M–O) and high (P–R) magnification images are shown at each stage. Notch2 was detected throughout the XY gonad at 11.5 dpc (M,P), and localized to cells that are clustered around groups of germ cells at the beginning of testis cord development (N,Q). The Sertoli cell expression pattern was apparent at 12.5 dpc (C). At 13.5 dpc, β-gal expression was undetectable in Sertoli cells and shifted to interstitial cells in Notch2LacZ mice (O,R). Notch3 was not detected in XY gonads at 11.5 dpc (D). At 12.5 dpc, Notch3 was detected in the interstitium of the XY gonad (E,F). Hes5 and Hes1 were expressed in 11.5 dpc XY gonads (G,J). At 12.5 dpc, Hes5 was detected inside the cords (H,I), whereas Hes1 was detected in the interstitium (K,L). A,B,D,E,G,H,J,K were taken at 12× magnification; C,F were taken at 20× magnification; I,L,M–O were taken at 25× magnification; P–R were taken at 63× magnification. g, gonad; m, mesonephros; TC, testis cord; I, interstitium.

