Abstract
In this work we investigate the effects of echo planar imaging (EPI) distortions on diffusion tensor imaging (DTI) based fiber tractography results. We propose a simple experimental framework that would enable assessing the effects of EPI distortions on the accuracy and reproducibility of fiber tractography from a pilot study on a few subjects. We compare trajectories computed from two diffusion datasets collected on each subject that are identical except for the orientation of phase encode direction, either right–left (RL) or anterior–posterior (AP). We define metrics to assess potential discrepancies between RL and AP trajectories in association, commissural, and projection pathways. Results from measurements on a 3 Tesla clinical scanner indicated that the effects of EPI distortions on computed fiber trajectories are statistically significant and large in magnitude, potentially leading to erroneous inferences about brain connectivity. The correction of EPI distortion using an image-based registration approach showed a significant improvement in tract consistency and accuracy. Although obtained in the context of a DTI experiment, our findings are generally applicable to all EPI-based diffusion MRI tractography investigations, including high angular resolution (HARDI) methods. On the basis of our findings, we recommend adding an EPI distortion correction step to the diffusion MRI processing pipeline if the output is to be used for fiber tractography.
Keywords: Echo planar imaging, Diffusion tensor imaging, Fiber tractography, Image distortions, Susceptibility
Introduction
Diffusion Tensor Imaging (DTI) (Basser et al., 1994) and other diffusion MRI modalities have been extensively used to investigate the structure and architecture of the human brain. In addition to scalar quantities such as fractional anisotropy and mean diffusivity, vectorial information contained in the diffusion displacement profile has been exploited to gain information on the orientation of white matter fibers (Pajevic and Pierpaoli, 1999). DTI-based fiber “tractography” (Basser et al., 2000; Mori et al., 1999; Wedeen and Reese, 1997) methods have been used to extract plausible trajectories of major white matter pathways non-invasively (Catani and Schotten, 2008). More recently, tractography methods that aim at resolving multiple fiber bundles with different orientations in a voxel have been developed. These methods that generally require diffusion weighted images with a large number of diffusion sensitizing directions and relatively high b-values, go under the collective name of high angular resolution diffusion imaging (HARDI) (e.g., diffusion spectrum imaging (DSI) (Tuch, 2002), Q-Ball imaging (Tuch, December, 2004), (Frank, 2002; Tuch et al., 1999), PASMRI (Jansons and Alexander, 2003)). The reader is referred to Tournier et al. (2011) for a comprehensive review of these methods. In addition to recognizing the role of diffusion MRI as an important tool for segmenting major white matter tracts, within the neuroscience community, there is a widespread belief that these methods can play a key role in elucidating anatomical connectivity in the human brain non-invasively. The extensive list of approaches for multi-fiber based connectivity includes but is not limited to the works of Tuch (2002), Jansons and Alexander (2003), Blyth et al. (2003), Chen et al. (2004), Behrens et al. (2007), Anderson and Ding (2002), Tournier et al. (2004), Özarslan et al. (2006), Parker and Alexander (2005), Descoteaux et al. (2009), Jian and Vemuri (2007), Jeurissen et al. (2011) and Qazi et al. (2009). Given the prominent role of these techniques in neuroscience, it is relevant to investigate factors that may affect tract accuracy and reproducibility. Regardless of the particular post-processing method, diffusion weighted images used for diffusion MRI tractography are generally acquired with echo planar imaging (EPI) (Turner and Le Bihan, February, 1990). EPI has the advantage of being a very efficient acquisition modality, with excellent signal to noise per unit time. However, a well-known problem in echo planar images is the presence of geometrical and intensity distortions along the phase-encode direction caused by field inhomogeneities (Jezzard and Balban, 1995) and concomitant fields (Du et al., 2002). It should be noted that these EPI distortions are different from eddy current distortions, which are caused by the rapid switching of the diffusion sensitizing gradients. Eddy current distortions affect only diffusion weighted images, but not the images acquired with no diffusion sensitization (so called b=0 s/mm2 images). EPI distortions affect all images in the datasets, independently from their level of diffusion sensitization. Eddy current distortions have been recognized as a problem since the early days of diffusion MRI and they are now typically corrected in most diffusion MRI processing pipelines. EPI distortions, however, have been largely ignored. Correction of EPI distortion generally requires acquisition of additional data for B0 mapping (Jezzard and Balban, 1995). Approaches to EPI distortion correction that do not require B0 mapping using a dedicated T1 or T2 weighted structural target have been proposed (Kybic et al., 2000; Tao et al., 2009; Wu et al., 2008). They have been shown to perform similarly to B0 mapping (Wu et al., 2008), but despite improved user friendliness, their implementation is not widespread.
Previous works suggest that EPI distortions may impact DTI fiber tractography negatively, but a systematic investigation is lacking. Improvements on fiber tracts after B0-mapping type corrections have been reported (Lee et al., 2004, Andersson et al., 2004, and Pintjens et al., 2008) as well as improvements in tensor-derived scalar maps (Wu et al., 2008). In their work, Lee et al. (2004) employed a field-mapping based EPI distortion correction scheme to investigate for improvements in voxel-wise correspondences among fractional anisotropy (FA) images and their corresponding distortion-free anatomical T1W images. They also showed improvements in continuity and symmetry of prefrontal tracts of one subject using streamline tractography. In the same year, Andersson et al. (2004) showed that after EPI distortion correction, probabilistic thalamic–frontal cortex connections appeared anatomically improved. Embleton et al. (2010) investigated the effects of eddy currents and susceptibility induced distortions on tractography and functional MRI (fMRI) by employing a distortion correction scheme that is a variant of the reversed direction k-space traversal method (Bowtell et al., 1994). They showed improvements on both streamline and probabilistic tractography, as well as fMRI statistics. Pintjens et al. (2008) showed that susceptibility distortion correction with their proposed B0 map acquisition improves streamline tractography on a synthetic fiber dataset. Techavipoo et al. (2009) showed that with field inhomogeneity based EPI geometric distortion correction, tractography on optic nerves was feasible with healthy volunteers and multiple sclerosis patients. Gui et al. (2008) proposed a “distortion-free” pulse sequence, namely Turboprop, to show the improvements to streamline tractography of several anatomical fiber bundles.
In this work, we propose a framework that can be used to assess the severity of the effects of EPI distortions on virtually any fiber pathway that may be of interest. We study the effect of EPI distortions on association, commissural, and projection pathways in a population of healthy subjects on data collected on a 3 T clinical scanner. Finally we test the ability of an easy to implement image-based correction scheme to improve accuracy and reproducibility of the reconstructed fiber trajectories.
Materials and methods
Dataset
Five healthy volunteers aged 32 to 55 years, two males, three females, were scanned on a 3 Tesla GE Excite scanner using a sixteen channel coil (GE Medical Systems, Milwaukee, WI). All volunteers signed an informed consent under NIMH protocol t00M0085. Whole brain single-shot EPI DWI datasets were acquired with FOV=24 × 24 cm, slice thickness=2.5 mm, matrix size=128 × 128 (zero filled from 96 × 96), 66 axial slices, with parallel imaging factor of two and TR/TE of 20566/75 ms. No cardiac gating was performed. The DWI data set consisted of ten images with b=0 s/mm2, ten images with b=300 s/mm2 and 60 images with b=1100 s/mm2. For all subjects, two DTI scans were acquired with different phase encode directions, Anterior–Posterior (AP) or Right–Left (RL). Structural T2 weighted (T2W) and T1 weighted (T1W) anatomical images were also acquired with a fast spin echo sequence with the same FOV and 1.7 mm isotropic resolution and TR/TE of 7467/98 ms.
General analysis framework
In this work, we follow a systematic analysis scheme to understand the extent of the effects of EPI distortions on fiber tractography, and deduce if EPI distortion correction, a usually disregarded diffusion image processing step, has a crucial effect on the computed tracts. It can be postulated that if EPI distortions had minimal effects on tractography, fibers derived from tractography of AP and RL data would be similar. However, if the distortion effects were nonnegligible, these two versions of tractography would differ significantly even within a small population. In this case, correction of these distortions would:
reduce the tract dissimilarities between DT-EPI data with different phase encode directions,
reduce the asymmetries between left and right homologous tracts in both AP and RL datasets,
improve the overall anatomical accuracy of “connectivity” maps.
Our strategy to verify these hypotheses involved visual and quantitative comparison of tract images from the same population of subjects. To achieve this goal, for each subject's data and for each phase encode direction, an EPI distortion correction step was either performed, producing the “corrected data”, or not, yielding the original distorted, or “uncorrected data” (DTI processing section). To analyze the relationship between distortion directions and tract orientations, a total of five representative anatomical pathways were chosen for a probabilistic tractography analysis (Fiber tractography section), which generated individual tract images for each subject in the population and each data mode ({AP,RL} × {corr,uncorr}). Subsequently, an average tract image was derived over the population for each of these tract bundles and data mode images.
The average tract images were primarily the basis of our visual and statistical examinations (Fiber tractography section). Several analyses have been performed on these images:
Any abnormal deviations from the expected tract anatomy were visually determined.
Differences in “connectivity” (as determined by probabilistic tracking visitation counts) between different categories were visually identified.
Improvements in bilateral symmetry with the corrected data were quantitatively measured.
Spatial variances of the tracts were quantized as a function of the distance from the seed ROIs to yield spatial tract signatures. These signatures were employed to compare tract behaviors.
Dice overlap measures (Dice, 1945) were used to quantify the agreements of tracts before and after correction for each tract bundle and phase encode direction.
DTI processing
Processing of DWIs was performed with algorithms included in the TORTOISE software package (Pierpaoli et al., 2010). The diffusion weighted images for all subjects, for both the AP and RL datasets, were first corrected for motion and eddy current distortions with the method proposed by Rohde et al. (2004), which includes proper reorientation of the B-matrix to account for rotational differences among the diffusion weighted volumes, and an intensity correction based on the Jacobian of the transformations (Jones and Cercignani, 2010; Leemans and Jones, 2009; Rohde et al., 2004). The next step in the processing pipeline was the application of EPI distortion correction, which produced the “corrected” version of the data, in addition to the “uncorrected” version, which did not undergo this step. This correction was performed using the approach previously presented by Wu et al. (2008). Briefly, this approach entails elastically registering the first b=0 s/mm2 image in each DWI set to its corresponding undistorted T2W structural image, with a cubic B-spline transformation of knot grid size 10 × 10 × 10, partitioning the image space into 2.4 × 2.4 × 1.65 cm3 cubes. This transformation was constrained to model deformations only along the phase encoding direction.
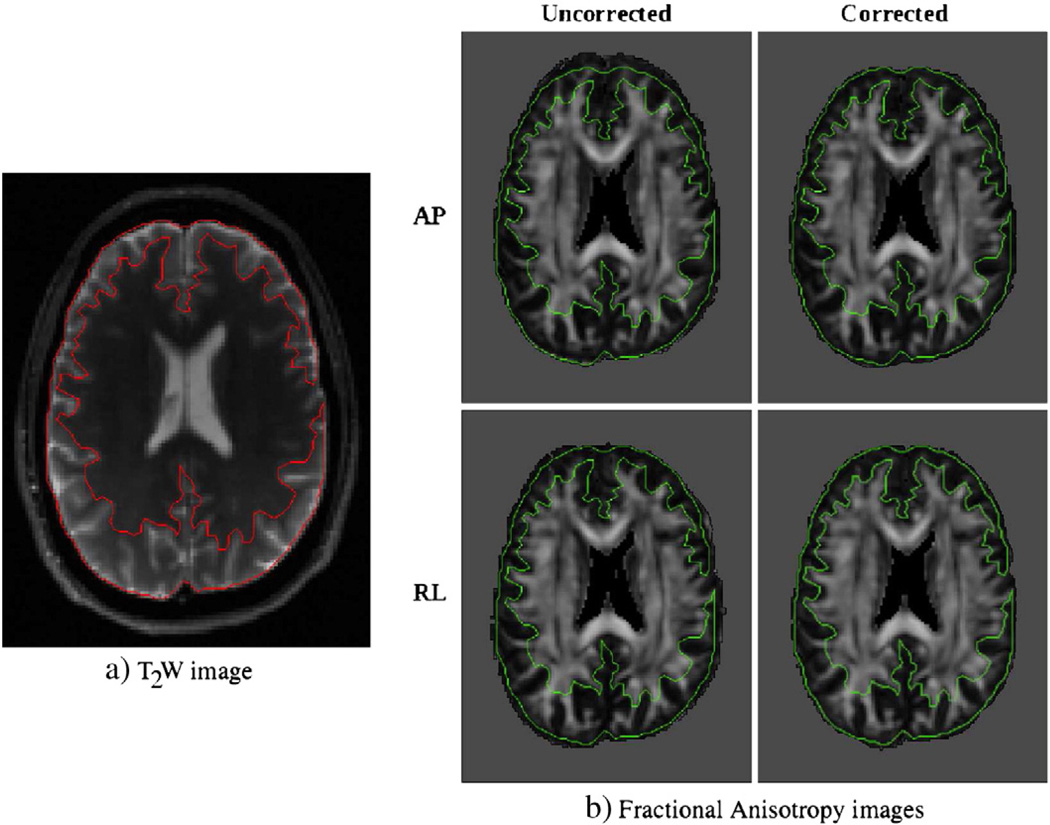
The computed deformation field was applied to all DWIs in that dataset, yielding four datasets for each subject (APcorr, APuncorr, RLcorr, RLuncorr). All corrections were performed in the native space of the diffusion weighted images. For consistency, all images were reoriented onto a common space defined by the mid-sagittal plane, the anterior commissure, and the posterior commissure (ACPC) (Bazin et al., 2007). Tensor fitting on all data was performed using non-linear optimization. Fig. 1 displays the T2W and the fractional anisotropy (FA) images computed from the corrected and uncorrected versions of the AP and RL datasets of a single subject as an example. The boundary of the T2W image is overlayed onto the FA images to emphasize the shape differences due to phase encode direction.
Fig. 1.
Outputs of registration for EPI distortion correction. The image on the left is the T2W structural image used as a target with boundaries indicated with a contour. Images on the right are the FA maps computed from data with different phase encode and correction schemes, with the same contour overlayed. For both uncorrected cases, the subject's brain extends out of the contour region in the direction of phase encoding, whereas this issue is minimized after elastic registration based correction.
Anatomical pathways
Five anatomical pathways were chosen for analysis: corpus callosum (CC), cortical spinal tracts (CST), inferior cerebellar peduncles (ICP), superior cerebellar peduncles (SCP), and the cingulum bundle (CB). This set of representative pathways was selected due to:
Their well-known anatomical trajectories to visually ensure anatomical correctness.
Their proximity to region interfaces with large susceptibility differences to observe distortion effects.
Their directional coverage, i.e., CST for projection fibers (mostly Inferior–Superior direction), CB for association fibers (mostly Anterior–Posterior direction), CC for commisural fibers (mostly Right–Left direction), and inferior and superior cerebellar peduncles (varying directions).
For CST and ICP, a one voxel size ROI was placed deep in the brain stem on both lateral hemispheres, exactly at the same anatomical location for the data of each subject. At such a deep level, the brain stem region is densely packed with different fiber bundles and for both tract pathways, a one voxel ROI that was not partially contaminated by the surrounding tissue types was selected to generate homogeneous tracts.
Unlike the brain stem ROIs, for the CB, two large ROIs including the voxels contaminated by CSF were chosen with one on an axial and one on a coronal slice, and the tracts were generated using a two ROI approach (See Fig. 2). For visual analysis of the cingulum, the entire tract bundle generated using these two ROIs was considered, whereas for quantitative analysis, only the portion of the tracts residing in between the two ROIs was used for the analysis. For SCP, ROIs of three voxels were placed on both hemispheres on an axial slice.
Fig. 2.
ROIs illustrated for the pathways chosen for analysis. One voxel size ROIs for ICP and CST are displayed in a). For SCP, three voxel size ROIs were chosen on both hemispheres b). The size of the two ROIs for the cingulum bundle of a single hemisphere varied based on the data and all voxels were included to account for partial volume interference.
For CC, small ROIs at the edge of the genu and splenium were manually placed and then used in streamline tractography to observe the local tract stabilities (Fig. 5).
Fig. 5.
Streamline tractography seeded from a single voxel ROI at the periphery of the genu of the corpus callosum. In the uncorrected data, pathways go off-track into the surrounding CSF and only one long range tract survives. In the corrected data several long tracts are traced.
Fiber tractography
Four of the five selected pathways (except CC) were used to analyze population-wide behaviors of the fibers for which the tract images were obtained with probabilistic tractography. Probabilistic tractography as proposed by Behrens et al. (2007) is a tool for analysis of DTI based “connectivity” that provides information on expected reproducibility within a single scan. Unlike deterministic tractography, the outputs of the probabilistic approach are 3D images, where the voxel values indicate the visitation counts from a large number of tracts sampled from the diffusion probability distributions. This property also provides the opportunity to employ well-established image-based methods to combine tract images into a population averaged representation. For these reasons, to investigate the improvements of EPI distortion correction and the effects of phase encode direction on tract reproducibility, a probabilistic tractography framework was employed using the FSL software package (Smith et al., 2004). Ten thousand tracts were cast from each voxel in the ICP, SCP, CST, and CB ROIs with a curvature threshold of 0.2. This fiber tracking procedure was performed in native space for each data and the left and right hemisphere connectivity images for the same anatomical structure were combined to yield a single image to be used for assessing symmetry improvements. Additionally, for each tract image, voxels with a number of visitations less than 5% of the initial total number of tracts were thresholded out. In the CC deterministic tractography was performed on an individual basis. The CC is a relatively thick bundle with parallel fiber trajectories and we reasoned that an inconsistent tensor orientation within the CC would not be detected for tractography trajectories positioned at the center of the structure. However, pathways seeded at the periphery of the CC will be likely to go off-track into the surrounding CSF if the underlying relative tensor orientation is incorrect due to EPI distortions. Therefore, in order to investigate the effects of EPI distortion at the genu and splenium of the CC, we seeded ROIs at the periphery of the structure. However, because of the difficulty in achieving consistent reproducibility of the positioning of these peripheral ROIs across subjects, we did not perform probabilistic tractography and population analysis for this data.
Population ROIs and average tract images
In order to perform accurate analysis, tracts for each data and each bundle need to be traced from the exact same anatomical location. Therefore, a mapping between the images was required. For this reason, the diffusion tensor images for every subject, for each phase encode direction and correction scheme, were fed into a tensor field based elastic registration routine which provided the transformations that mapped an image onto another. This registration process was performed using the DTI-TK software package (Zhang et al., 2007). The reader should note that the tensor images were not warped at this point but only the transformations were computed.
The ROIs described in Anatomical pathways were defined manually on the Directionally Encoded Color (DEC) maps (Pajevic and Pierpaoli, 1999) obtained from uncorrected images separately for AP and RL data. The contour of the ROI followed the image grid: i.e., a voxel would be fully included in the ROI or fully excluded; the contour of the ROI would not split voxels. The transformations described above were used to transform the shape and location of the ROI from the uncorrected to the corrected space. At this stage the perimeter of the new ROI did not have to coincide with the boundaries of the voxels in the corrected image. We included in the final ROI for the corrected image, voxels that had the largest overlap with the transformed ROI. For each ROI, the number of voxels was kept the same for uncorrected and corrected ROI.
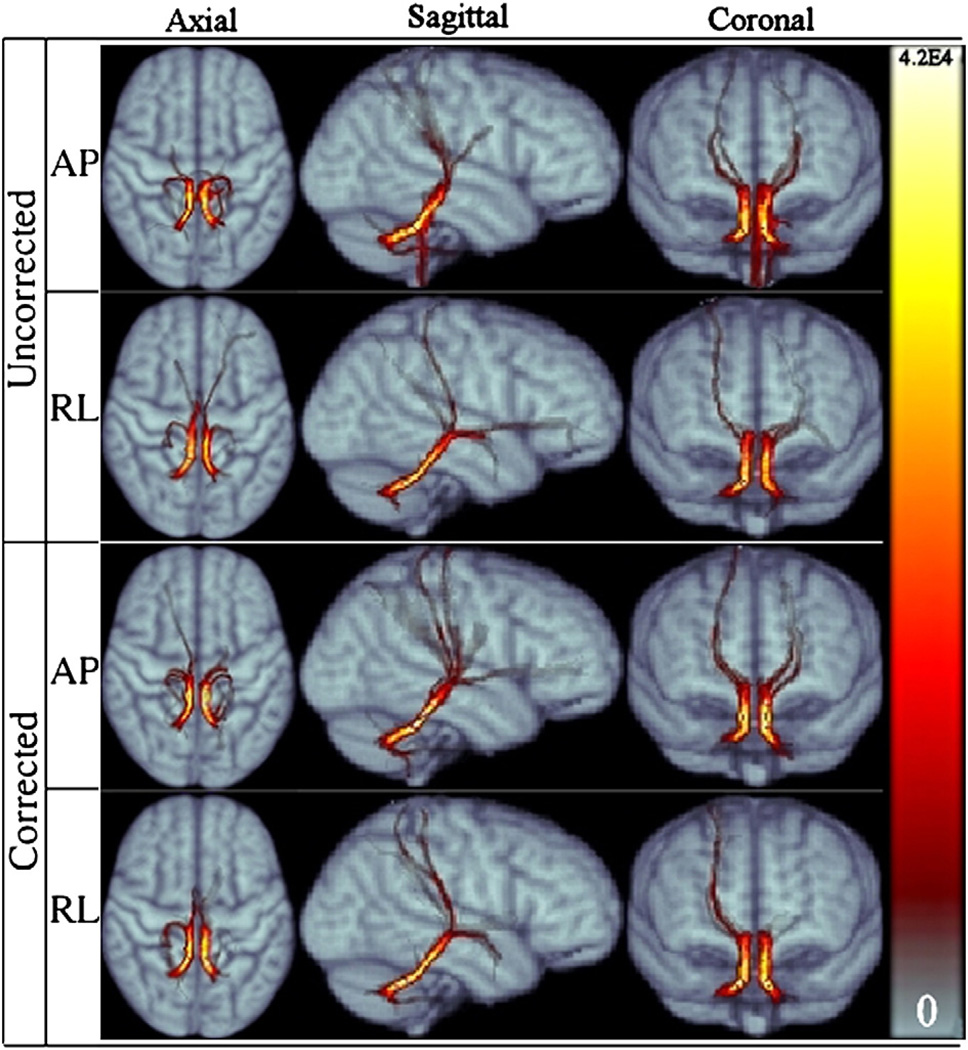
After all the ROIs were defined, probabilistic tractography was carried out in the native space for each subject. To create probabilistic images for the population, such as those shown in Figs. 6, 9, 11 and 13, the computed tract images were transformed from their native space onto the common coordinate framework using the transformations obtained through the tensor registration process.
Fig. 6.
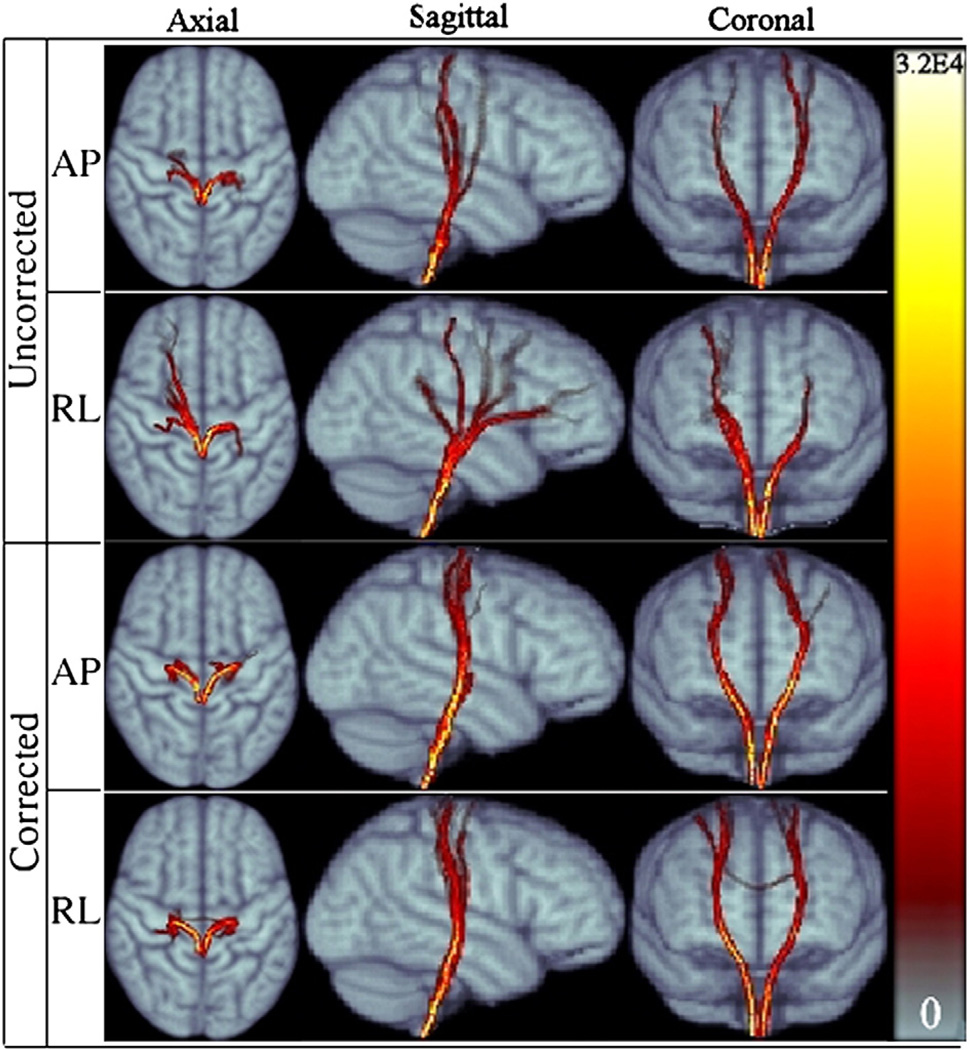
Population averaged CST for RL and AP data for both corrected and uncorrected cases displayed in three main views. The symmetry of right and left tracts of APuncorr is improved after distortion correction in APcorr. Both corrected versions have a higher probability of reaching the cortex. Colormap on the right indicates the number of visitations of tract voxels.
Fig. 9.
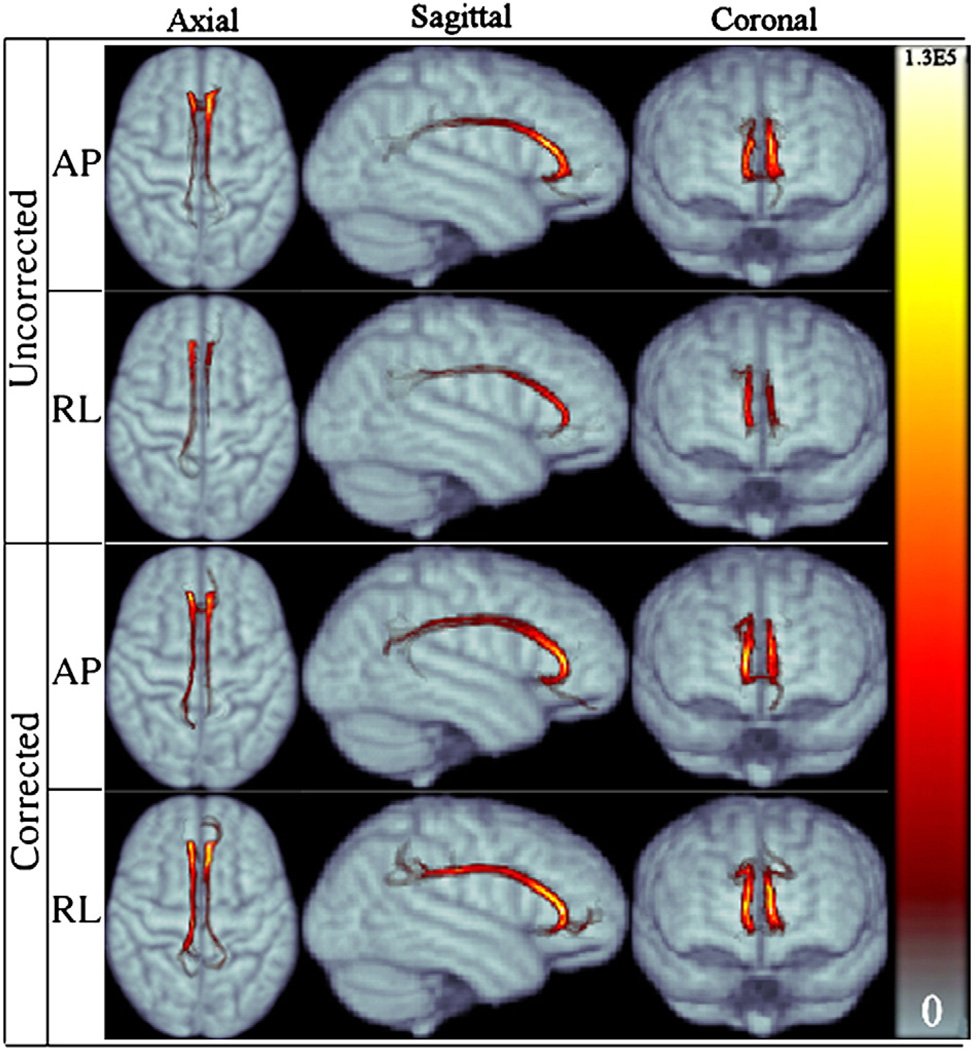
Population average CB tract for RL and AP data for both corrected and uncorrected cases displayed in three main views.
Fig. 11.
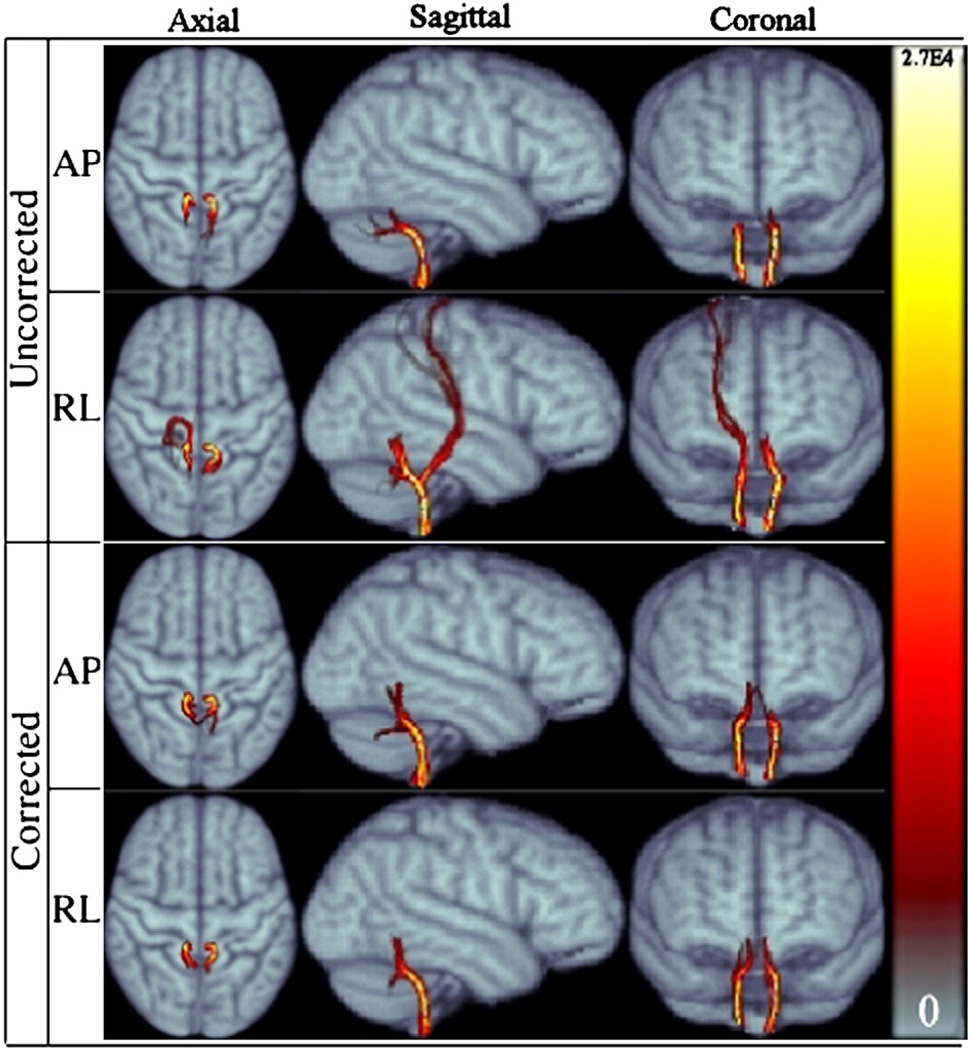
Population average ICP tract for RL and AP data for both corrected and uncorrected cases displayed in three main views.
Fig. 13.
Population average SCP tract for RL and AP data for both corrected and uncorrected cases, displayed in three main views.
Deterministic streamline tractography was also performed for each subject, using the same ROIs employed for the probabilistic approach. The vertices of the deterministic tracts were transformed onto the average brain space using the described transformations. The streamline tracts from all subjects were combined in this common space and all subject tracts were visualized together to depict the population-wide behavior.
Visual and statistical analysis
The effects of EPI distortions and their corrections on tractography were analyzed from several perspectives such as fidelity to the underlying anatomy, continuity, and improvements in bilateral symmetry.
Visual analysis
Glyphs and streamline tracts from a single subject's data were first visually inspected to verify the presence of local mismatch of tensor orientations and the underlying shape. Spurious or lost tracts were also visually determined. Population average probabilistic tract images were first visually inspected to determine any global abnormalities, such as anatomically incorrect pathways and extreme bilateral asymmetries. For visual assessment of the quality of probabilistic tractography, the tract images were rendered using volume rendering. The tracts were rendered on the average T1W image, again visualized with volume rendering. The deterministic tracts for the population were examined to determine if different conclusions would be drawn from streamline tractography compared to the those inferred from the probabilistic approach.
Quantitative analysis
For quantitative examination, three different analyses were carried out using features derived from population average probabilistic tract images to quantitatively assess the stability of tracts, bilateral asymmetry, and their spatial variance.
- Spatial variance: To analyze the spatial stability of tracts, we followed an approach derived from the work of Lazar and Alexander (2005). In essence, we took all voxels from a particular (Euclidean) distance from the seed ROI, weighted each voxel's spatial coordinate by the visitation number for that voxel, and computed the covariance matrix. The primary eigenvalue of the covariance matrix represents the magnitude of the variance along the principal mode at that distance from the seed. This process is repeated for all distances from the seed until there are no more voxels with visitations. The spatial variance is plotted against the distance from the seed ROI to create a spatial variance signature for each tract, which can be compared before and after correction. These signatures can be interpreted to measure:
-
–similarities between the shape of tracts acquired or corrected with different modalities. Tracts with similar trajectories would yield similar looking signatures.
-
–the spatial spread of the tracts. Spatially reproducible tracts are hypothesized to have smaller variances at large distances from the seed ROIs.
-
–the presence of lost tracts. A sudden decrease in tract signature before completion indicates that some tracts deviated from their main anatomical trajectory and terminated prematurely.
-
–
- Bilateral symmetry: Differences are anatomically expected in the pathways of right and left hemisphere fibers, but not at drastic levels. To quantitatively assess dramatic changes in bilateral symmetry, a heuristic symmetry measure was used: The symmetry plane of the average structural image was initially extracted manually. This symmetry plane can be used as the symmetry plane of the tract images thanks to the registration process described in Population ROIs and average tract images. Each tract image I was flipped along the RL direction using this symmetry plane, to generate the flipped images, I F . The symmetry measure is described as:
where × signifies the voxel id and Ω represents the image domain. This measure takes the value 0 when there is no mirror-overlap and takes the value 1 when the tracts in both hemispheres are completely identical. - Dice overlap measures: Dice overlap metrics (Dice, 1945) were used to measure the improvements in consistency in between the AP and RL average tract data. For each tract bundle, the Dice measure is defined as:
was computed to quantitatively measure if the AP and RL tracts are more consistent with each other after distortion correction. A Dice metric of zero indicates no match between the compared images, whereas the value one indicates a perfect match. In this work, we employed the Dice metric on the visitation counts directly, instead of its typical use on binary segmented images employed in Dauguet et al. (2007) and O'Muircheartaigh et al. (2011).
Results
The original distorted data, the EPI distortion corrected version, the employed ROIs, the probabilistic tract images, and the population average tract images can be downloaded from: http://science.nichd.nih.gov/confluence/display/nihpd/Download.
Local tractography visual inspection
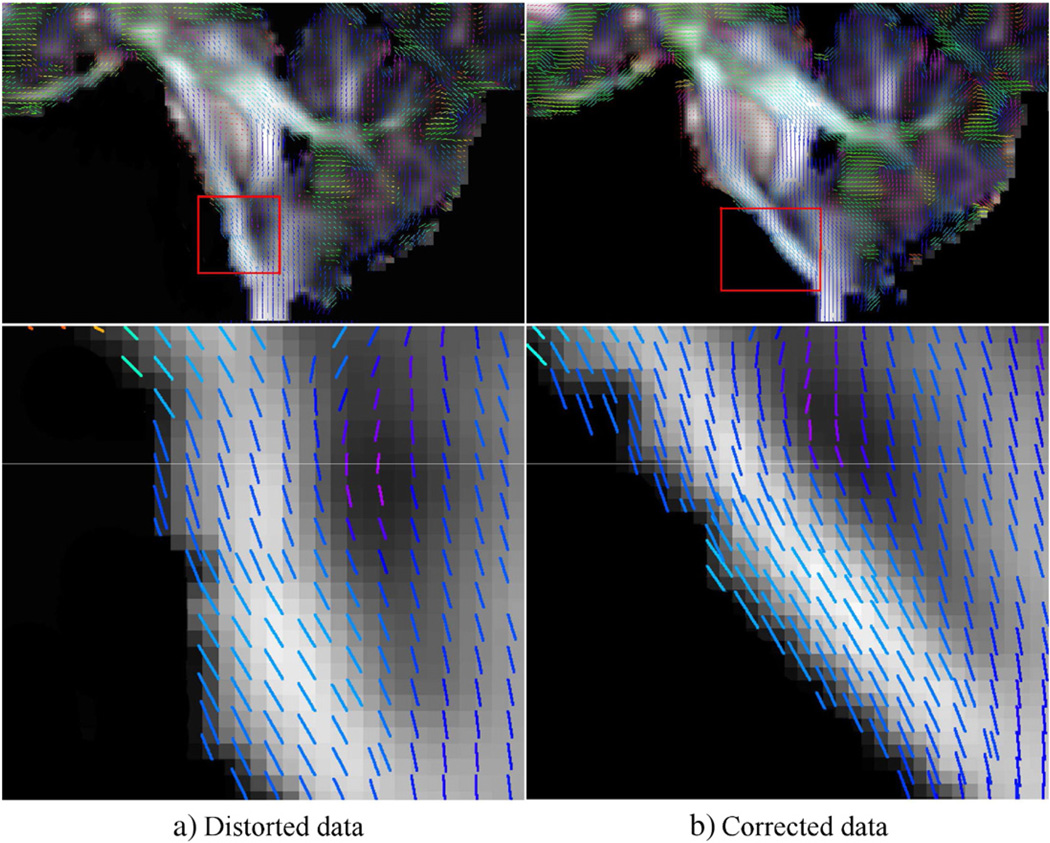
Fig. 3 is an example that depicts the problems arising due to EPI distortions. The line glyphs displayed on this figure are computed from diffusion tensor data acquired with AP phase encode direction. The data on the left column a) is the original, distorted version, whereas the one on the right b) has gone through EPI distortion correction before tensor computation. From these two versions of the same data, it can be observed that the region of the brain stem inferior to the pons is deformed in the Anterior–Posterior direction. The orientation of this anatomical structure is significantly different between the original distorted data and its distortion-corrected counterpart. The orientations of the principal eigenvector are virtually the same in the corrected and uncorrected images but the orientation is consistent with the shape of the underlying structure only in the corrected image.
Fig. 3.
Tensor glyphs visualized as lines for clarity on the Fractional Anisotropy (FA) images computed from a) distorted, and b) distortion corrected data of the same subject. The images on the top row give a global view of the anatomy and the images on the second row zoom in to the area indicated by the red rectangles. In the uncorrected data, the eigenvector field is inconsistent with the orientation of the underlying anatomy.
This inconsistency between distorted anatomy and underlying eigenvector orientation leads to wrong tract trajectories in the uncorrected images. In tractography the effects of a small local distortion become relevant due to the accumulated effects along the trajectories. Fig. 4 displays streamline tractography results on the cingulum bundle from two ROIs again using the original distorted data and its EPI distortion corrected version acquired with RL phase encode direction. Due to the displacement of the anatomical location on the coronal ROIs, the two tract sets remain disconnected in the distorted data, whereas continuity is achieved when EPI distortions are eliminated.
Fig. 4.
Streamline fiber tractography of the cingulum bundle seeding independently from two ROIs positioned as indicated by arrows in: a) Tracts are visualized on DEC maps of an axial and coronal slice. b) Tracts from the two ROIs do not connect when the original distorted data is used for tractography. c) After distortion correction, continuity is achieved with ROIs at the exact same anatomical locations.
The discontinuity of trajectory of the cingulum bundle when seeded from different ROIs in the uncorrected images shown in Fig. 4 b), is a clear example of this phenomenon. After correction, continuity is achieved (Fig. 4 c)). In Fig. 5, a single voxel ROI at the posterior-side edge of the genu of the corpus callosum was used as a seeding ROI for deterministic tractography. In Fig. 5, tracts originating from the seed ROIs exceeding a 2 voxel length threshold are displayed for both the distorted data (left) and its corrected counterpart (right). While only one tract can be traced in the distorted data, numerous, longer, and anatomically plausible tracts were obtained from the same ROI in the data that underwent EPI distortion correction.
Population average tract images
Projection fibers
Fig. 6 displays the population averaged cortical spinal probabilistic tracts (CST) for both AP and RL data, corrected and uncorrected versions. The effect of phase encode direction is prominent when the uncorrected data is examined. The CST were particularly sensitive to distortions along the RL direction, which caused the majority of the trajectories to become spurious and reach anatomically incorrect brain regions. This result can be attributed to the fact that CST fibers at the level of the inferior aspect of the pons where we seeded the ROI run adjacent to other differently oriented pathways. In the presence of distortions in the RL direction, even a relatively small displacement can cause the tracts to join other fiber bundles. This behavior was less prevalent with the data acquired with the AP direction. Application of the distortion correction scheme significantly reduced the dissimilarities between AP and RL tract bundles.
RL distortion affects right and left homologous tracts differently, which results in loss of bilateral symmetry of the computed trajectories. This can be observed from the axial representation of RL uncorr . Trajectories computed from the corrected RL data exhibit symmetry of left and right CST and a plausible anatomical termination in the cortex.
Another improvement with correction for both directions is the increase in probability of reaching the cortical regions of the brain. This result can be observed from the higher number of visitations, as indicated by the colormap legend, in the cortical regions in the corrected versions compared to the lighter tones in the distorted case.
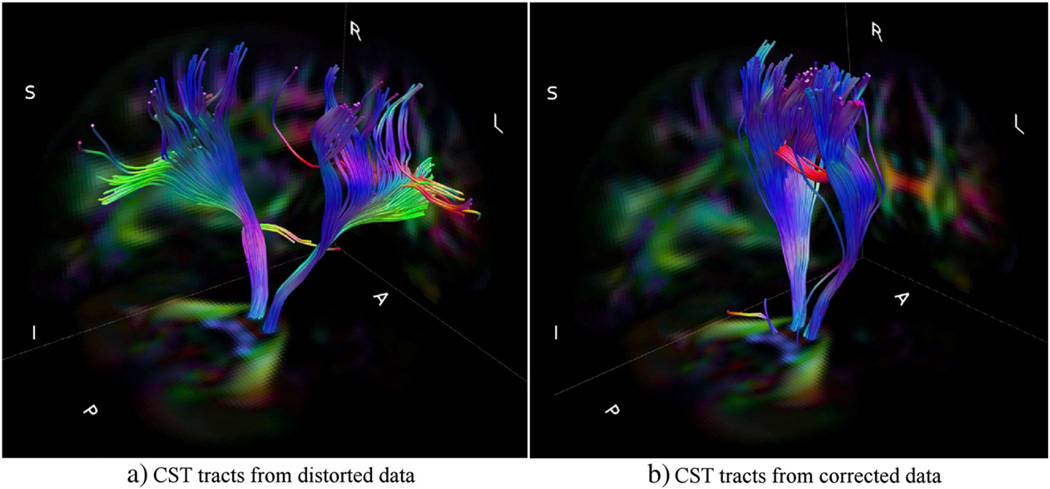
All examined deterministic tracts for the population showed similar shape features as those obtained by the probabilistic method. As an example, we present in Fig. 7 the population averaged deterministic cortical spinal tracts (CST) for the RL data, both uncorrected (a) and corrected (b).
Fig. 7.
Population averaged deterministic CST for RL data for both corrected a) and uncorrected b) cases. By comparing this figure with Fig. 6, it can be noticed that similar effects of the EPI distortion can be inferred from both a deterministic and a probabilistic representation of the population results. Considerable improvements are obtained after correction.
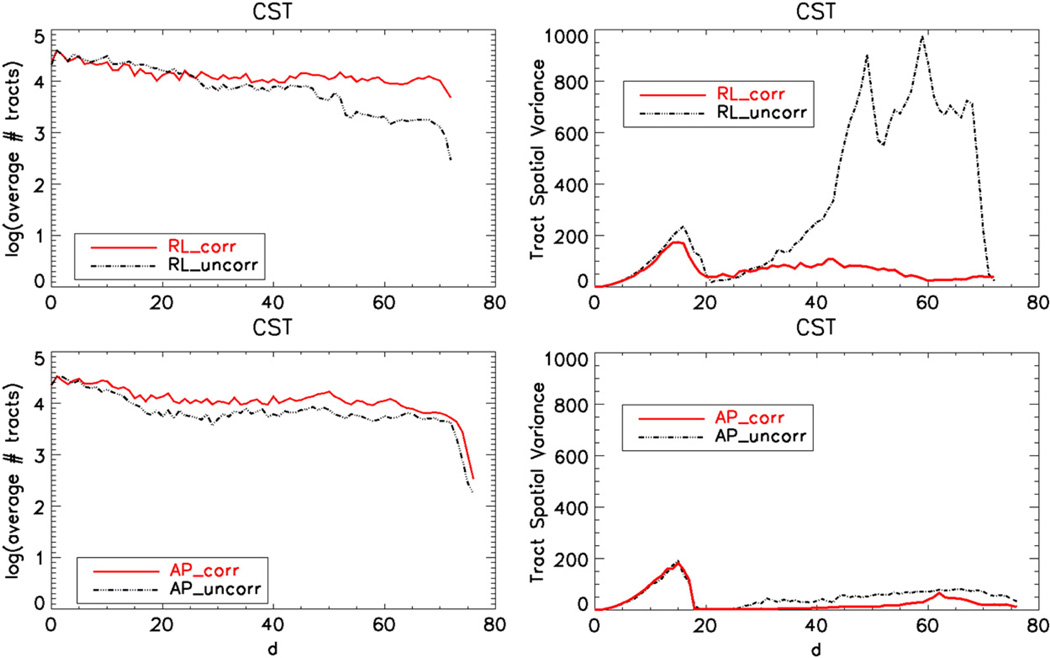
The spatial variance signature is illustrated in Fig. 8, where the left column plots display the (log) number of tracts at a specific distance from the seed ROI and right column plots display the spatial signatures. The top plots in this figure illustrate the signatures of tracts obtained from data with RL phase encode direction and the bottom plots for AP phase encoding.
Fig. 8.
CST signatures displaying the spatial variance of the tract voxels as a function of distance from the seed ROI (d). The top row images are obtained using data acquired with RL and the bottom row with AP phase encoding directions. The number of tracts as functions of the same distances is also provided in the left column to ease interpretation of the variance signatures.
As implied visually by Fig. 6, the distorted and corrected tracts with AP direction have very similar spatial variability. Some number of tracts is lost in the AP uncorr bundle, which can be observed from the lower number of tracts in the bottom left image. The spatial variance of AP uncorr is slightly larger than the corrected counterpart at large distances, but this difference is not significant. However, the effect of correction on the signatures of the RL encoded data is considerable.
The RLuncorr data's spatial variance signature displays a similar behavior to the AP version within twenty voxels of the seed ROI. However, after this point the tracts in RLuncorr start to branch, thus yielding very large spatial variances. The two sudden decreases in the variance signatures around 50 units away from the seed ROI are likely due to spurious tracts ending.
Distortion correction on the RLuncorr data significantly improves tract quality. Spatial tract variances are reduced at large distances from the seed ROI and the consistency between the AP and RL data is increased as indicated by more similar tract signature shapes. Another observation that can be drawn from the tract number signature of RL data is the widening gap between RLuncorr and its corrected counterpart RLcorr. This difference in the tract number signatures indicates that tracts were progressively lost in the uncorrected version, whereas distortion correction was able to solve this issue.
Association fibers
When cingulum bundle (CB) tractography images are examined, the most striking finding is the improvement after EPI correction for both RL and AP. This is indicated by the increase in visitation counts at distance from the seed and an overall increase in the degree of left–right symmetry which can be observed in Fig. 9 and in Table 1. Before correction, in the data acquired with AP phase encode direction, the tracts on the left brain hemisphere (radiological convention) showed stronger “connectivity” (i.e. had more visitation counts) than right brain tracts, whereas the opposite behavior was observed in RL data.
Table 1.
Symmetry measures for bilateral tracts. 0 means no symmetry, whereas 1 indicates complete bilateral symmetry.
| APuncorr | APcorr | RLuncorr | RLcorr | |
|---|---|---|---|---|
| CST | 0.352 | 0.441 | 0.244 | 0.475 |
| ICP | 0.586 | 0.511 | 0.181 | 0.554 |
| SCP | 0.550 | 0.559 | 0.586 | 0.544 |
| CB | 0.541 | 0.508 | 0.292 | 0.504 |
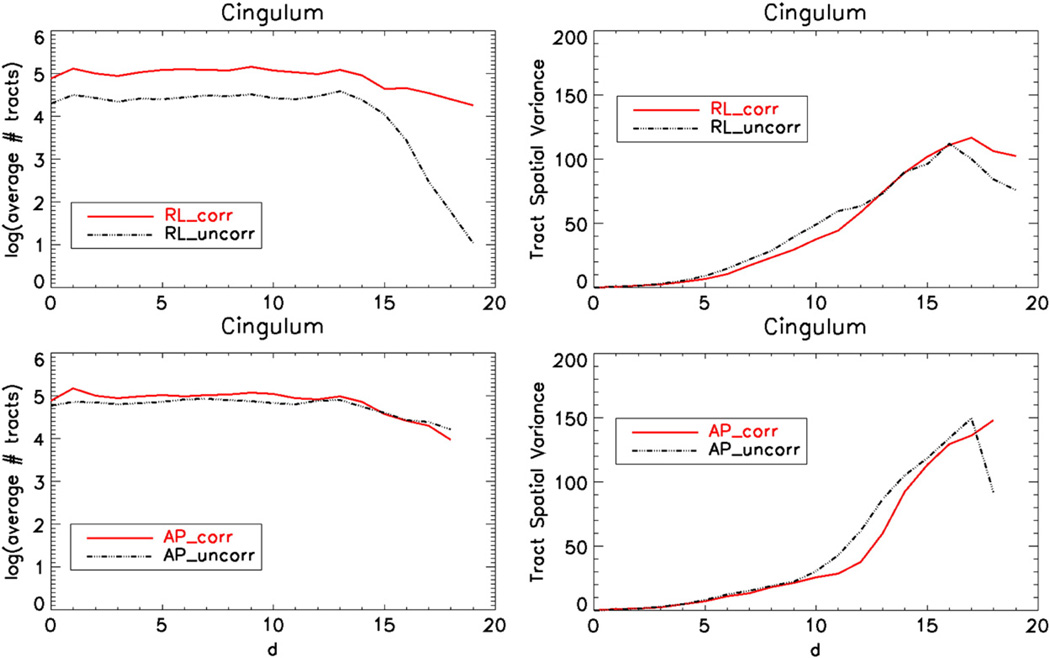
Fig. 10 displays the tract count signatures and spatial variance plots obtained for the CB. In this case the tractography was performed using two seed ROIs and the interpretation of these plots should take this into account. Variance signatures for both phase encoding directions and for both the corrected and uncorrected data show similar behaviors, but this is due to the constraints imposed by the two ROI seed which limits the inclusion of spurious trajectories. However, RL tract count signatures have different properties before and after correction. Even though the same number of tracts was initially cast from the first seed ROI, only the tracts reaching the second ROI are included. Essentially the “lost” tracts do not increase variability but reduce the number of tracts included in the bundle. The original distorted data for RL have a significantly lower number of tracts and distortion correction improves this situation.
Fig. 10.
Cingulum bundle tract signatures displaying the spatial variance of the tract voxels as a function of distance from the seed ROI. The top row images are obtained using data acquired with RL and the bottom row with AP phase encoding directions. The number of tracts as functions of the same distances is also provided in the left column.
Cerebellar fibers
Fig. 11 displays the probabilistic tracts for the population averaged inferior cerebellar peduncles (ICP), for all data versions. Due to the proximity of the ICP ROIs to other anatomical structures such as sensory or motor fibers, these tracts are sensitive to ROI placements. Among four versions of the data, only RLuncorr tracts were erroneously mixed up with sensory tracts and reached superior cortical regions. Distortion correction solved this problem and RLcorr only generated plausible tracts. Additionally, tracts in the left hemispheres for RLuncorr data correctly reached the cerebellum but the bundle in the right hemisphere turned towards the anterior direction. This also drastically altered bilateral symmetry (Table 1) even when the erroneous tracts reaching the cortex are excluded. This behavior is visible in the axial and coronal slices of Fig. 11 when regions inferior to the cerebellum are examined. From a consistency standpoint, when the shapes of the anatomically feasible parts of ICP tracts are examined in all data, it can be observed that the curvature of the APuncorr tracts turning towards the cerebellum is relatively larger than the curvatures in the other three data versions for the same location, i.e., RLuncorr tracts bend more sharply into the cerebellum. With the distortion correction, the curvature of this bending is similar in both versions of the data acquired with AP phase encoding. Anatomically, it might be hard to assess the correctness of these two types of curvatures; however, an increase in similarity of the corrected tract images with respect to the uncorrected ones indicates an improvement on conformance of the tracts to the anatomy.
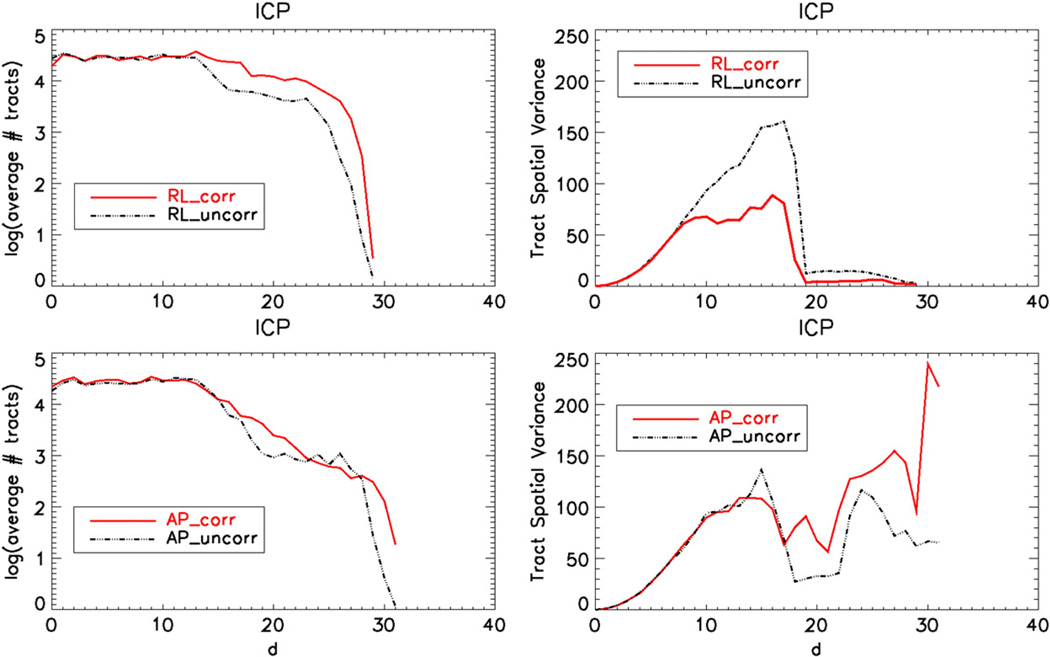
The spatial variance signature for ICP in Fig. 12 indicates that the spatial behavior of ICP before and after correction is very similar with the AP distortion direction within eighteen voxels from the seed ROI. Anatomically plausible tracts should reside in this region. The uncorrected version of the RL data has higher spatial variance within this region. It should be noted that APcorr yielded more spurious tracts at levels higher than cerebellum.
Fig. 12.
Right hemisphere ICP bundle tract signatures displaying the spatial variance of the tract voxels as a function of distance from the seed ROI. The top row images are obtained using data acquired with RL and the bottom row with titAP phase encoding directions. The number of tracts as functions of the same distances is also provided in the left column.
Fig. 13 displays the tractography outputs for the superior cerebellar peduncles. SCP turned out to be a tract bundle quite unaffected by the direction of phase encoding. The portion of the tract inferior to the decussation is consistently depicted by all four data with a high degree of symmetry between left and right trajectories.
Symmetry results and Dice overlap metrics
Table 1 displays the values of symmetry metrics for each fiber bundle and each data version. The lowest symmetry scores were obtained with uncorrected RL data for the CST and cingulum bundles for reasons described in the preceding sections. ICP's low score can be attributed to the spurious tracts that join the cortical–spinal tracts. SCP tracts yielded relatively high values of the measure. For the ICP bundle, the corrected version of the AP data has a slightly lower value than the uncorrected version.
Table 2 displays the values of the Dice overlap metrics. Because these metrics were computed using the visitation counts directly, they are lower than what they would have been were binary segmentation maps used. For all tract bundles, distortion correction improved the consistency between the AP and RL average tract images, which can be observed from the higher overlap values in the right column of the table.
Table 2.
Dice overlap metrics for each tract bundle between AP and RL tracts before and after correction. AP/RL consistency is improved for each bundle after correction.
| APuncorr/RLuncorr | APcorr/RLcorr | |
|---|---|---|
| CST | 0.380 | 0.451 |
| ICP | 0.299 | 0.521 |
| SCP | 0.507 | 0.612 |
| CB | 0.410 | 0.589 |
Discussion
In this work we investigated the effects of echo planar imaging distortions caused by magnetic susceptibility differences and concomitant fields on diffusion tensor imaging based fiber tractography. These distortions manifest themselves as displacements along the phase encode direction, therefore we used data with different phase encoding directions to evaluate their effects on tracts. We also evaluated the effects of an easily usable and simple distortion correction protocol.
The primary finding of this study was that the effects of EPI distortions on the examined tracts were not only statistically significant, but also quite large in magnitude. This behavior was observed with deterministic tractography while examining the corpus callosum pathways from each single subject's data, where it was shown that tracts traced from the periphery of this structure are more likely to go off-track when distortions are not corrected. Representative projection, commissural and association pathways were examined within a population using both deterministic and probabilistic tractography. Probabilistic tractography was chosen as the main framework for reporting the results of this investigation because it could account for intra-subject variability effects in addition to bias and variability effects on the population. Projection fibers and association fibers suffered most from these distortions, regardless of the employed phase encode direction. Clearly, the effects of image distortions on a tract are not only dependent on the magnitude of the distortion, but also on the topological characteristics of the tract and the architectural features of white matter regions surrounding the tract (Jones and Pierpaoli, 2005). The inferior cerebellar peduncles (ICP) and cortical–spinal tracts (CST) run in a highly trafficked area of the brainstem and a small error in the underlying tensor field makes the tracts prone to jump into anatomically unrelated adjacent pathways, therefore CST and ICP were found to show spurious trajectories in the presence of distortions.
All selected pathways, with the exception of the superior cerebellar peduncles, showed marked asymmetry across hemispheres when phase encoding was applied in the Right–Left direction. It should be noted that small variations in the symmetry metric could be due to real anatomical differences. However, real anatomical asymmetries should be small, not depend on the direction of phase encoding, and be unaffected by EPI correction. On the contrary, left right differences were sometimes dramatic and clearly inconsistent with known anatomy, they depended highly on the phase encoding direction used, and were significantly modified by the EPI correction. For example, the symmetry metrics were much higher for CST, ICP, and the cingulum bundle (CB) when data were acquired with RL phase encode direction rather than AP. Symmetry generally improved after EPI correction. The fact that the symmetry value is relatively high in the AP direction even before correction, is not surprising. An anterior– posterior distortion gives origin to anatomically incorrect tracts, however, these incorrect homologous tracts will still maintain left–right hemisphere symmetry given that the orientation of the distortion lies on the sagittal brain plane of symmetry.
An interesting finding in analyzing the population effects of EPI distortions is that distortions are more likely to result in biased, rather than more variable fiber trajectories. For example, CST computed from distorted images showed low combined intra- and inter-subject variability, but the anatomical accuracy of the depicted trajectories was poor, especially with RL distortion in all subjects. This finding may seem puzzling at first, but bias is not an uncommon outcome of confounding factors in DTI results, such as several experimental and physiological noise artifacts affecting diffusion MRI (Pierpaoli, 2010; Walker et al., 2011). This bias that manifests itself with high reproducibility among subjects is difficult to handle in statistical analysis, because statistical tests are generally designed to account for noise-induced increased variance but not artifact-induced bias. The bias effects of the EPI distortion can be found to affect also the population analysis of deterministic tractography.
The findings of this study indicate that some form of EPI distortion correction methodology should be included in diffusion imaging processing pipelines. This finding is particularly relevant for situations in which accuracy of the computed trajectories is important, such as neuro-surgical planning and neuroscience connectivity studies. Additionally, for imaging protocols with Right–Left as the phase encode direction, EPI distortion correction becomes unavoidable especially if tracts of interest run juxtaposed to other bundles in a small region, such as the cortico-spinal tracts; or if tracts run in the Anterior–Posterior or Inferior–Superior direction with a small cross-section, such as the cingulum bundle; or if assessment of bilateral symmetry is an important analysis point, such as in studies involving language pathways.
A handful of EPI distortion correction methods have been proposed, differing in their approach to the problem including image based approaches (Kybic et al., 2000; Tao et al., 2009; Wu et al., 2008); field-mapping based approaches (Andersson et al., 2004; Jezzard and Balban, 1995; Lee et al., 2004; Pintjens et al., 2008); and new pulse sequence based corrections (Embleton et al., 2010; Gui et al., 2008; Techavipoo et al., 2009). Here we decided to use an image registration based method for correction of EPI distortions because it requires only an undistorted structural image with signal characteristics similar to that of the b=0 s/mm2 diffusion weighted image. Often, T2 weighted structural images are acquired during the MRI session. If not, the added time for collecting a high resolution, high quality, T2 weighted fast spin echo image that can be used as a structural target image for EPI registration is less than three minutes on modern scanners. When we corrected the diffusion images with our image registration based method, we found considerable improvements in the quality of the resulting tract pathways. However, the correction methodology employed in this work is based on elastic image registration and elastic registration algorithms have intrinsic weaknesses. They need to cope with locally highly non-linear distortions and suffer from local minima. One could hypothesize that the results of EPI correction could be further improved in the future if more sophisticated correction schemes are employed. The framework provided in this paper is suited to assess quantitatively the improvement in performance provided by alternative algorithms.
In our experiments, we observed that in addition to highly localized distortions, our images were suffering from more slowly varying distortions probably originating from concomitant fields. The mathematical formalism to address distortion corrections originating from concomitant fields is similar to that for the correction of eddy current effects. Rohde et al. (2004) pointed out that in order to properly correct eddy current distortions, a global linear transformation is not sufficient, and a quadratic term must be added. The Rohde procedure for eddy current correction, which is implemented in the TORTOISE package (Pierpaoli et al., 2010), is ideally suited for EPI distortion correction originating from concomitant fields. In our EPI distortion correction scheme, we used Rohde's correction as initialization to improve the convergence of elastic registration based algorithms for EPI correction with excellent results. This improvement can be attributed to the elimination of some local minima for the elastic registration thanks to better initialization of the parameter space.
It is important to note that the data used in this study were acquired with a 3 T GE scanner and the effects of distortions will be more or less severe based on field strength, model, and manufacturer of the scanner. We believe that by employing the strategy we used in this work, clinical investigators would be able to assess the effect of EPI distortions in their particular situation and to evaluate the efficacy of their preferred correction strategy. As large size diffusion imaging studies are becoming more and more common, the need to assess the effects on the results of potential experimental confounds, such as EPI image distortion, is becoming more pressing. Therefore, for such large studies, it might be beneficial to conduct an initial pilot study to evaluate the data quality for different experimental conditions. The conclusions drawn from a pilot study can shed light on the severity of EPI distortions and can give insights on how the phase encode direction for the main study should be selected, what kind of EPI distortion correction scheme should be employed and, therefore, what type of additional data, T2W image or a fieldmap, should be acquired.
For image registration based correction methods, two questions arise: 1) what type of structural image should be used and should the B-matrix be rotated after EPI distortion correction? Elastic registration is a very unconstrained procedure with a large number of parameters. For this reason, the structural image used as a target in the registration process should have similar features and contrast to the b=0 s/mm2 EPI image. In our experience, high resolution T1W images result in a poorer registration than a T2W weighted image acquired —with long TE and fat suppression, as we used in this study. T1W images usually have high signal for the skull and soft tissue areas, which cause an over-stretching of brain tissue in adjacent regions.
The effects of B-matrix rotation during DWI processing have been previously addressed (Leemans and Jones, 2009; Rohde et al., 2004). The question of whether the B-matrix should be rotated to account for the rotation effects introduced by the EPI distortion correction may arise. As for the case of eddy current distortions, the underlying directionality of diffusion sensitization is unaffected by the presence of EPI distortions. In other words, the underlying computed tensor is correct; what leads to improper fiber trajectories is the distorted shape of the brain. Therefore, the answer is simple: if we correct the shape of the images, we do not have to rotate the B-matrix. Obviously, one does need to rotate the matrix to account for any rotational correction necessary because of subject motion and/or final reorientation of DWIs into a given space. In the TORTOISE software reorientation of B-matrices is performed according to (Rohde et al., 2004), without need for user intervention, automatically accounting for the origin of rotation terms, with no reorientation if the rotation term originates from eddy currents and EPI distortion correction.
Finally we would like to discuss the applicability of our findings to non-tensor based tractography or connectivity approaches. The diffusion tensor model describes the tissue water diffusion displacement profile as an ellipsoid and does not resolve multiple fiber populations in a voxel. The trend in tractography is to employ more complicated diffusion models, such as the ones provided by high angular resolution diffusion imaging (HARDI) acquisitions, which can describe more complicated diffusion displacement profiles and enable the reconstruction of a multi-fiber population from a single voxel. Although our results are reported for tensor based tractography, EPI distortions will also certainly affect fiber trajectories computed from HARDI acquisitions. In general, susceptibility effects are likely to be more pronounced for HARDI data because of the typically longer echo times required for the more heavy diffusion weighting required by HARDI analysis. Therefore, we believe that EPI distortion correction should be applied in diffusion MRI tractography for both DTI and other HARDI schemes such as DSI (Tuch, 2002), Q-ball imaging (Tuch, December, 2004), PASMRI (Jansons and Alexander, 2003), and the mixture of tensor models. It should also be noted that EPI distortions are more severe at high magnetic fields; therefore, the effects that we noticed at 3 T are likely to be small compared to those observed with similar sequences at higher fields.
Acknowledgments
This research was supported by the Intramural Research Program of the Eunice Kennedy Shriver National Institute of Child Health and Human Development (NICHD), National Institutes of Health (NIH). Support for this work included funding from Department of Defense in the Center for Neuroscience and Regenerative Medicine (CNRM). The authors would also like to thank Liz Salak for editing this manuscript and the Henry M. Jackson Foundation (HJF) for their administrative support.
References
- Anderson A, Ding Z. Sub-voxel measurement of fiber orientation using high angular resolution diffusion tensor imaging. Proceedings of International Society of Magnetic Resonance in Medicine. 2002:440. [Google Scholar]
- Andersson JL, Richter M, Richter W, Skare S, Nunes RG, Robson MD, Behrens TE. Effects of susceptibility distortions on tractography. Proceedings of International Society of Magnetic Resonance in Medicine. 2004;Vol. 11:87. [Google Scholar]
- Basser PJ, Mattiello J, Le Bihan D. Estimation of the effective self-diffusion tensor from the NMR spin echo. J. Magn. Reson. 1994;103:247–254. doi: 10.1006/jmrb.1994.1037. [DOI] [PubMed] [Google Scholar]
- Basser PJ, Pajevic S, Pierpaoli C, Duda J, Aroubi A. In vivo fiber tractography using DT-MRI data. Magn. Reson. Med. 2000;44(4):625–632. doi: 10.1002/1522-2594(200010)44:4<625::aid-mrm17>3.0.co;2-o. [DOI] [PubMed] [Google Scholar]
- Bazin PL, Cuzzocreo JL, Yassa MA, Gandler W, Mcauliffe MJ, Bassett SS, Pham DL. Volumetric neuroimage analysis extensions for the MIPAV software package. J. Neurosci. Methods. 2007;165(1):111–121. doi: 10.1016/j.jneumeth.2007.05.024. [DOI] [PMC free article] [PubMed] [Google Scholar]
- Behrens TEJ, Berg HJ, Jbabdi S, Rushworth MFS, Woolrich MW. Probabilistic diffusion tractography with multiple fibre orientations: what can we gain? NeuroImage. 2007;34(1):144–155. doi: 10.1016/j.neuroimage.2006.09.018. [DOI] [PMC free article] [PubMed] [Google Scholar]
- Blyth R, Cook PA, Alexander DC. Tractography with multiple fibre orientations. Proceedings of International Society of Magnetic Resonance in Medicine. 2003:240. [Google Scholar]
- Bowtell R, McIntyre DJO, Commandre MJ, Glover PM, Mansfield P. Proceedings of 2nd Annual Meeting of the SMR. San Francisco: 1994. Correction of geometric distortion in echo planar images. [Google Scholar]
- Catani M, Schotten MT. A diffusion tensor imaging tractography atlas for virtual in vivo dissections. Cortex. 2008;44(8):1105–1132. doi: 10.1016/j.cortex.2008.05.004. [DOI] [PubMed] [Google Scholar]
- Chen Y, Guo W, Zeng Q, He G, Vemuri BC, Liu W. Recovery of intra-voxel structure from HARD DWI. International Symposium on Biomedical Imaging. 2004 [Google Scholar]
- Dauguet J, Peled S, Berezovskii V, Delzescaux T, Warfield SK, Born R, Westin C-F. Comparison of fiber tracts derived from in-vivo DTI tractography with 3D histological neural tract tracer reconstruction on a macaque brain. NeuroImage. 2007;37(2):530–538. doi: 10.1016/j.neuroimage.2007.04.067. [DOI] [PubMed] [Google Scholar]
- Descoteaux M, Deriche R, Knoesche T, Anwander A. Deterministic and probabilistic tractography based on complex fiber orientation distributions. IEEE Trans. Med. Imaging. 2009;28(2):269–286. doi: 10.1109/TMI.2008.2004424. [DOI] [PubMed] [Google Scholar]
- Dice LR. Measures of the amount of ecologic association between species. Ecology. 1945;26(3):297–302. [Google Scholar]
- Du YP, Zhou XJ, Bernstein MA. Correction of concomitant magnetic field-induced image artifacts in nonaxial echo-planar imaging. Magn. Reson. Med. 2002;48(3):509–515. doi: 10.1002/mrm.10249. [DOI] [PubMed] [Google Scholar]
- Embleton KV, Haroon HA, Morris DM, Ralph MAL, Parker GJ. Distortion correction for diffusion-weighted MRI tractography and fMRI in the temporal lobes. Hum. Brain Mapp. 2010;31(10):1570–1587. doi: 10.1002/hbm.20959. [DOI] [PMC free article] [PubMed] [Google Scholar]
- Frank LR. Characterization of anisotropy in high angular resolution diffusion-weighted MRI. Magn. Reson. Med. 2002;47:1083–1099. doi: 10.1002/mrm.10156. [DOI] [PubMed] [Google Scholar]
- Gui M, Peng H, Carew JD, Lesniak MS, Arfanakis K. A tractography comparison between turboprop and spin-echo echo-planar diffusion tensor imaging. NeuroImage. 2008;42:1451–1462. doi: 10.1016/j.neuroimage.2008.05.066. [DOI] [PMC free article] [PubMed] [Google Scholar]
- Jansons KM, Alexander DC. Persistent angular structure: new insights from diffusion MRI data. Inverse Probl. 2003;19:1031–1046. doi: 10.1007/978-3-540-45087-0_56. [DOI] [PubMed] [Google Scholar]
- Jeurissen B, Leemans A, Jones DK, Tournier JD, Sijbers J. Probabilistic fiber tracking using the residual bootstrap with constrained spherical deconvolution. Hum. Brain Mapp. 2011 Mar;32(3):461–479. doi: 10.1002/hbm.21032. [DOI] [PMC free article] [PubMed] [Google Scholar]
- Jezzard P, Balban R. Correction for geometric distortion in echo planar images from B0 field variations. Magn. Reson. Med. 1995;34:65–73. doi: 10.1002/mrm.1910340111. [DOI] [PubMed] [Google Scholar]
- Jian B, Vemuri BC. A unified computational framework for deconvolution to reconstruct multiple fibers from diffusion weighted MRI. IEEE Trans. Med. Imaging. 2007;26(11):1464–1471. doi: 10.1109/TMI.2007.907552. [DOI] [PMC free article] [PubMed] [Google Scholar]
- Jones DK, Cercignani M. Twenty-five pitfalls in the analysis of diffusion MRI data. NMR Biomed. 2010;23(7):803–820. doi: 10.1002/nbm.1543. [DOI] [PubMed] [Google Scholar]
- Jones DK, Pierpaoli C. Confidence mapping in diffusion tensor magnetic resonance imaging tractography using a bootstrap approach. Magn. Reson. Med. 2005;53:1143–1149. doi: 10.1002/mrm.20466. [DOI] [PubMed] [Google Scholar]
- Kybic J, Thevenaz P, Nirkko A, Unser M. Unwarping of unidirectionally distorted EPI images. IEEE Trans. Med. Imaging. 2000;19(2):80–93. doi: 10.1109/42.836368. [DOI] [PubMed] [Google Scholar]
- Lazar M, Alexander AL. Bootstrap white matter tractography (BOOT-TRAC) NeuroImage. 2005;24(2):524–532. doi: 10.1016/j.neuroimage.2004.08.050. [DOI] [PubMed] [Google Scholar]
- Lee J, Laza M, Holden J, Griley E, Alexander AL. Correction of B0 EPI distortions in diffusion tensor imaging and white matter tractography. Proc. Int. Soc. Magn. Reson. Med. 2004;11:2172. [Google Scholar]
- Leemans A, Jones DK. The B-matrix must be rotated when correcting for subject motion in DTI data. Magn. Reson. Med. 2009;61(6):1336–1349. doi: 10.1002/mrm.21890. [DOI] [PubMed] [Google Scholar]
- Mori S, Crain BJ, Chacko VP, van Zijl PC. Three-dimensional tracking of axonal projections in the brain bymagnetic resonance imaging. Ann.Neurol. 1999;45(2):265–269. doi: 10.1002/1531-8249(199902)45:2<265::aid-ana21>3.0.co;2-3. [DOI] [PubMed] [Google Scholar]
- O'Muircheartaigh J, Vollmar C, Traynor C, Barker GJ, Kumari V, Symms MR, Thompson P, Duncan JS, Koepp MJ, Richardson MP. Clustering probabilistic tractograms using independent component analysis applied to the thalamus. NeuroImage. 2011;54(3):2020–2032. doi: 10.1016/j.neuroimage.2010.09.054. [DOI] [PMC free article] [PubMed] [Google Scholar]
- Özarslan E, Shepherd TM, Vemuri BC, Blackhand SJ, Mareci TH. Resolution of complex tissue microarchitecture using the diffusion orientation transform (DOT) NeuroImage. 2006;31(3):1086–1103. doi: 10.1016/j.neuroimage.2006.01.024. [DOI] [PubMed] [Google Scholar]
- Pajevic S, Pierpaoli C. Color schemes to represent the orientation of anisotropic tissues from diffusion tensor data: application to white matter fiber tract mapping in the human brain. Magn. Reson. Med. 1999;42:526–540. [PubMed] [Google Scholar]
- Parker G, Alexander DC. Probabilistic anatomic connectivity derived from the microscopic persistent angular structure of cerebral tissue. Philos. Trans. R. Soc. 2005;360(1457):893–902. doi: 10.1098/rstb.2005.1639. [DOI] [PMC free article] [PubMed] [Google Scholar]
- Pierpaoli C. Artifacts in diffusion MRI. In: Jones DK, editor. Diffusion MRI: Theory, Methods, and Applications. Oxford University Press; 2010. [Google Scholar]
- Pierpaoli C, Walker L, Irfanoglu MO, Barnett AS, Chang LC, Koay CG, Pajevic S, Rohde GK, Sarlls J, Wu M. Proceedings of International Society of Magnetic Resonance in Medicine. Sweden: Stockholm; 2010. Tortoise: an integrated software package for processing of diffusion MRI data. [Google Scholar]
- Pintjens W, Poot DHJ, Verhoye M, Linden AVD, Sijbers J. Susceptibility correction for improved tractography using high field DT-EPI. Proceedings of SPIE Medical Imaging. 2008 Feb;:6914. [Google Scholar]
- Qazi AA, Radmanesh A, O'Donnell L, Kindlmann G, Peled S, Whalen S, Westin CF, Golby AJ. Resolving crossings in the corticospinal tract by two-tensor streamline tractography: method and clinical assessment using fMRI. NeuroImage. 2009;47:T98–T106. doi: 10.1016/j.neuroimage.2008.06.034. [DOI] [PMC free article] [PubMed] [Google Scholar]
- Rohde GK, Barnett AS, Basser PJ, Marenco S, Pierpaoli C. Comprehensive approach for correction of motion and distortion in diffusion weighted MRI. Magn. Reson. Med. 2004;51(1):103–114. doi: 10.1002/mrm.10677. [DOI] [PubMed] [Google Scholar]
- Smith SM, Jenkinson M, Woolrich MW, Beckmann CF, Behrens TE, Johansen-Berg H, Bannister PR, Luca MD, Drobnjak I, Flitney DE, Niazy RK, Saunders J, Vickers J, Zhang Y, Stefano ND, Brady JM, Matthews PM. Advances in functional and structural MR image analysis and implementation as FSL. NeuroImage. 2004;23(1):208–219. doi: 10.1016/j.neuroimage.2004.07.051. [DOI] [PubMed] [Google Scholar]
- Tao R, Fletcher PT, Gerber S, Whitaker RT. A variational image-based approach to the correction of susceptibility artifacts in the alignment of diffusion weighted and structural MRI. Inf. Process. Med. Imaging. 2009;21:651–663. doi: 10.1007/978-3-642-02498-6_55. [DOI] [PMC free article] [PubMed] [Google Scholar]
- Techavipoo U, Okai AF, Lackey J, Shi J, Dresner MA, Leist TP, Lai S. Toward a practical protocol for human optic nerve DTI with EPI geometric distortion correction. J. Magn. Reson. Imaging. 2009;30:699–707. doi: 10.1002/jmri.21836. [DOI] [PubMed] [Google Scholar]
- Tournier JD, Calamante F, Gadian DG, Connely A. Direct estimation of the fiber orientation density function from diffusion-weighted MRI data using spherical deconvolution. NeuroImage. 2004;23:1176–1185. doi: 10.1016/j.neuroimage.2004.07.037. [DOI] [PubMed] [Google Scholar]
- Tournier JD, Mori S, Leemans A. Diffusion tensor imaging and beyond. Magn. Reson. Med. 2011;65(6):1532–1556. doi: 10.1002/mrm.22924. [DOI] [PMC free article] [PubMed] [Google Scholar]
- Tuch DS. Ph.D. thesis. Harvard; 2002. Diffusion MRI of complex tissue structure. [Google Scholar]
- Tuch DS. Q-ball imaging. Magn. Reson. Med. 2004 Dec;52(6):1358–1372. doi: 10.1002/mrm.20279. [DOI] [PubMed] [Google Scholar]
- Tuch DS, Weisskoff RM, Belliveau JW, Wedeen VJ. Proceedings of International Society of Magnetic Resonance in Medicine. Philadelphia: 1999. High angular resolution diffusion imaging of the human brain. [Google Scholar]
- Turner R, Le Bihan D. Single-shot diffusion imaging at 2.0 Tesla. J. Magn. Reson. 1990 Feb;86:445–452. [Google Scholar]
- Walker L, Chang LC, Koay CG, Sharma N, Cohen L, Verma R, Pierpaoli C. Effects of physiological noise in population analysis of diffusion tensor MRI data. NeuroImage. 2011;54:1168–1177. doi: 10.1016/j.neuroimage.2010.08.048. [DOI] [PMC free article] [PubMed] [Google Scholar]
- Wedeen VJ, Reese TG. Brain parenchyman strain and white matter stretch due to voluntary head motion. Proceedings of International Society of Magnetic Resonance in Medicine. 1997;Vol. 1:462. [Google Scholar]
- Wu M, Chang LC, Walker L, Lemaitre H, Barnett AS, Marenco S, Pierpaoli C. Comparison of EPI distortion correction methods in diffusion tensor MRI using a novel framework. Proc. MICCAI. 2008;11:321–329. doi: 10.1007/978-3-540-85990-1_39. [DOI] [PMC free article] [PubMed] [Google Scholar]
- Zhang H, Yushkevich P, Rueckert D, Gee J. Unbiased white matter atlas construction using diffusion tensor images. In: Ayache N, Ourselin S, Maeder A, editors. Proceedings of MICCAI. Vol. 4792 of Lecture Notes in Computer Science. Berlin/Heidelberg: Springer; 2007. pp. 211–218. [DOI] [PubMed] [Google Scholar]


