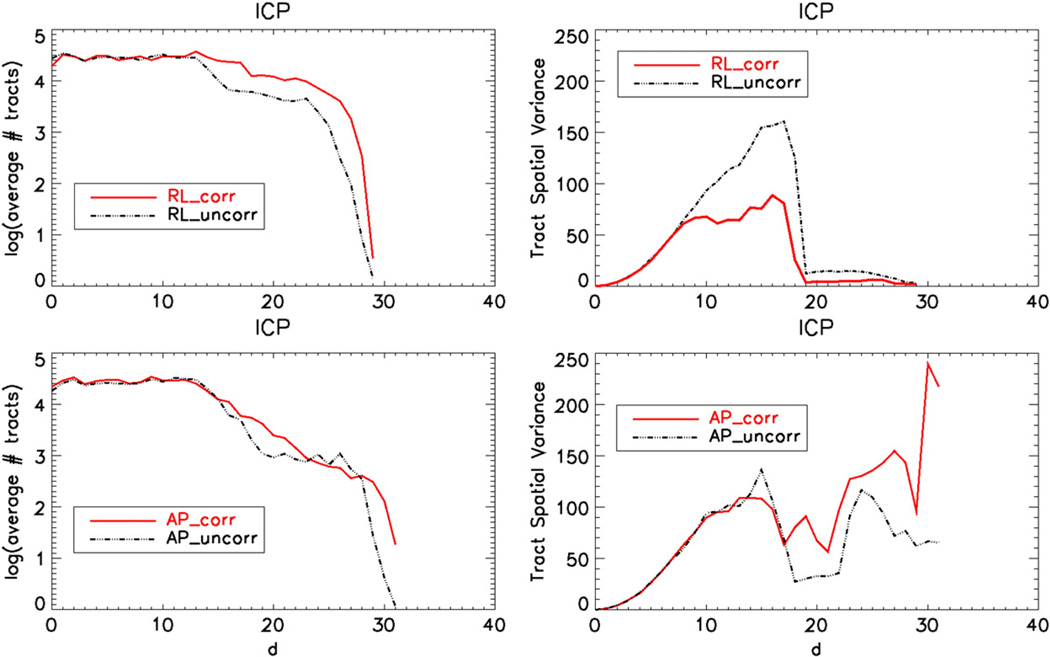
Fig. 12.
Right hemisphere ICP bundle tract signatures displaying the spatial variance of the tract voxels as a function of distance from the seed ROI. The top row images are obtained using data acquired with RL and the bottom row with titAP phase encoding directions. The number of tracts as functions of the same distances is also provided in the left column.

