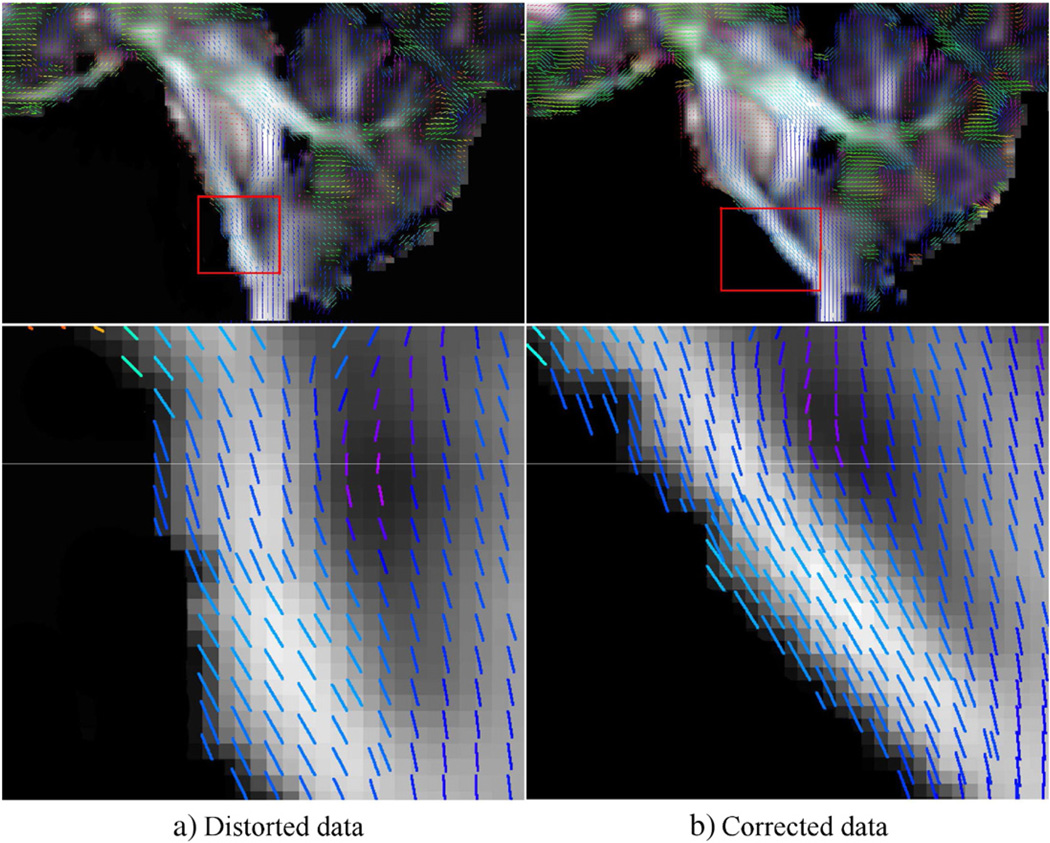
Fig. 3.
Tensor glyphs visualized as lines for clarity on the Fractional Anisotropy (FA) images computed from a) distorted, and b) distortion corrected data of the same subject. The images on the top row give a global view of the anatomy and the images on the second row zoom in to the area indicated by the red rectangles. In the uncorrected data, the eigenvector field is inconsistent with the orientation of the underlying anatomy.

