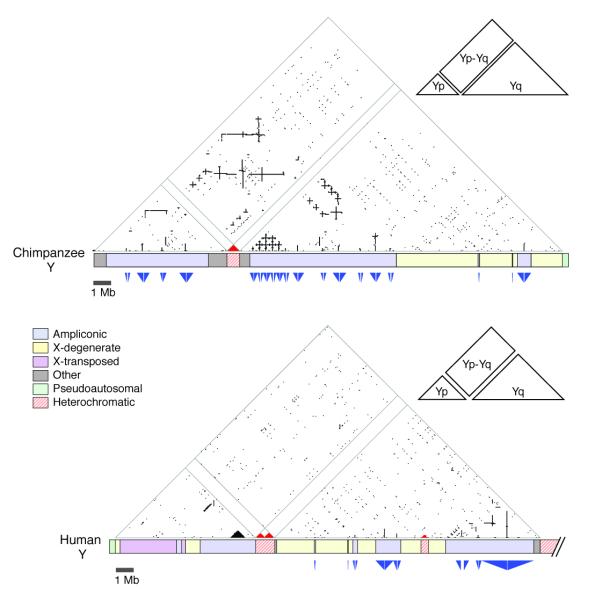
Figure 3.
Triangular dot plots of DNA sequence identities within euchromatic MSY of chimpanzee (top) and human (bottom). Each dot represents 100% intrachromosomal identity within a 200-bp window. Red dots represent matches between heterochromatic sequences. Direct repeats appear as horizontal lines, inverted repeats as vertical lines, and palindromes as vertical lines that nearly intersect the baseline. Insets indicate that each large triangular plot contains two smaller triangles (one revealing sequence identities within Yp and one revealing identities within Yq) and a rectangle (revealing sequence identities between Yp and Yq). Immediately below plots are schematic representations of chromosomes. Triangles below chromosome schematics denote sizes and locations of palindromes. Gaps between opposed triangles represent the non-duplicated spacers between palindrome arms.

