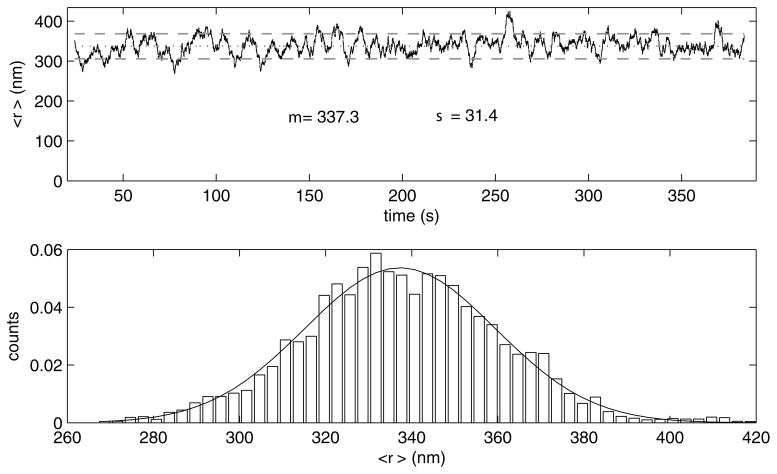
Figure 10.
A 4-second moving average (grey) of the xy excursions of the bead away from the anchor point for the bead in the lower panel of Figure 5 after exclusion of the interval with shifted x coordinates. The mean value for the the entire trace is 337.3 nm (dashed line) with a standard deviation of 31.4 nm (dotted line).

