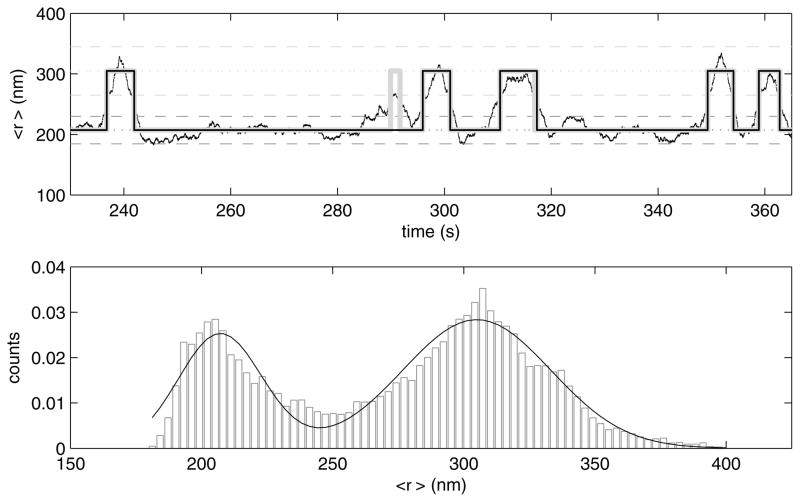
Figure 11.
(upper) The time average xy excursion of the bead about the tether point switches between two states when 100 nM CI protein is present. The moving average (dark points) intermittently switches between excursion values corresponding to looped (dark grey) and unlooped (light grey) states. The dotted lines represent average excursions bounded by standard deviations indicated by dashed lines. Transitions between these states are identified using a threshold crossing algorithm (broad light grey) and refined by retaining only states that endure longer than the dead time of the filter. (thin black line, overlaid on all but one of the broad grey steps). (lower) A histogram of xy excursion amplitudes observed for the tethered bead during the entire recoding of almost 1600 seconds clearly reveals two predominant excursion amplitudes which were fit using two Gaussians (curve).

