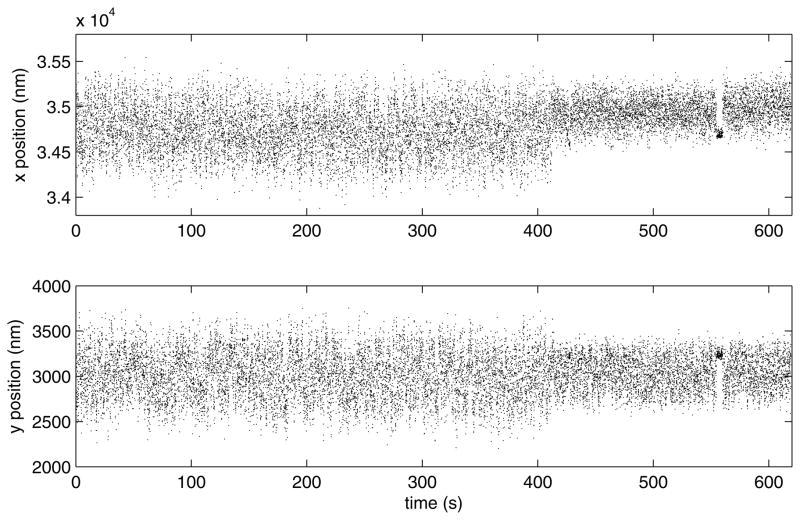
Figure 8.
After drift correction, x (upper) and y (lower) position versus time data show the Brownian motion along the x and y axis observed for the bead in the lower panel of Figure 6. Near 380 seconds, the x positions suddenly shift toward one side. In addition, during a brief interval near 535 seconds the bead adhered to the coverslip.

