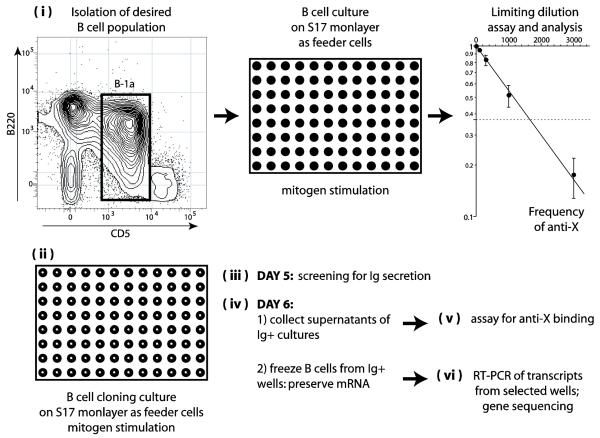
Figure 1. Schematic description of the strategy adopted for the quantitative analysis of the immunoglobulin repertoire.
Legend: (i) The desired population of B lymphocytes is isolated and cultivated with mitogens for 7 days in different cell numbers on monolayers of S17 stromal cells in flat-bottom 96 well plates. Supernatants of these cultures are tested for antigen binding and the frequency of secreting B cells producing antibodies to antigen “X” is estimated by limiting dilution analysis. (ii) A large number of replicates of B cell cultures, 0.66 cells/well round-bottom 96 well plates (B cell cloning cultures) are performed, the precise number depending on the frequency of anti-X lymphocytes obtained as above. (iii) On day 5 of culture, 25 microliters of supernatant are collected from each well and screened by ELISA for the presence of secreted immunoglobulin. (iv) On day 6 of culture, 20 microliters are collected from the bottom of the Ig+ wells to obtain B cells and plasmacytes and kept frozen (−80° C) in the presence of RNAse inhibitors. The remaining 200 microliters of supernatants of these wells are also collected for the antigen binding assay. (v) The collected supernatants are screened for binding to antigen “X”. (vi) Frozen samples of B cells and plasmacytes from wells that scored positive for anti-“X” are processed for one step RT-PCR for the amplification of VH and VL genes. Several frozen samples of B cells and plasmacytes from wells that scored negative for anti-“X” are also amplified and serve as controls.

