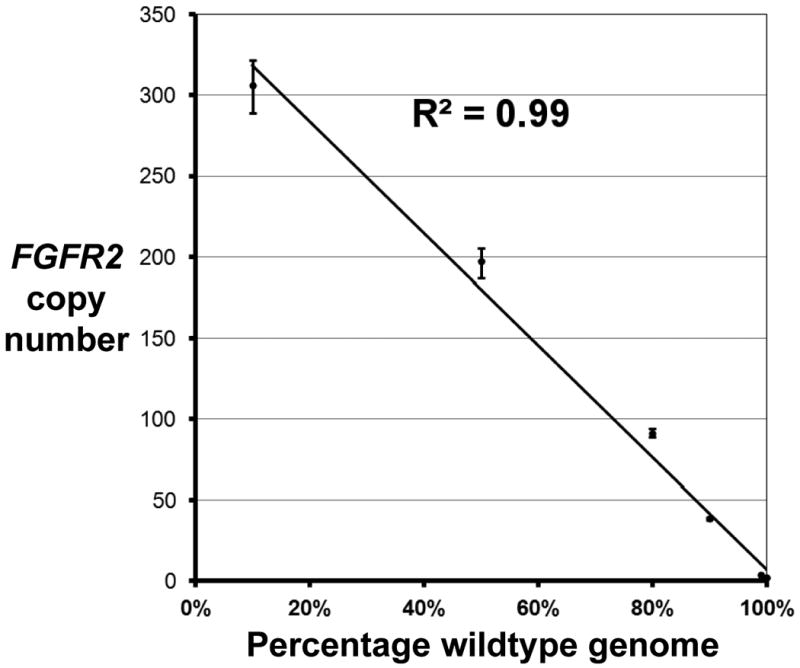
Figure 2.

Measurement of FGFR2 copy number from a dilution series of tumor versus normal genomic DNA using ddPCR.
To ascertain the limits of quantifying amplifications, KatoIII genomic DNA, known to harbor FGFR2 amplification, was diluted with a normal diploid genomic DNA in decreasing ratios. Data points with error bars represent the drop in FGFR2 copy number as the KatoIII genomic DNA is diluted with normal genomic DNA.
