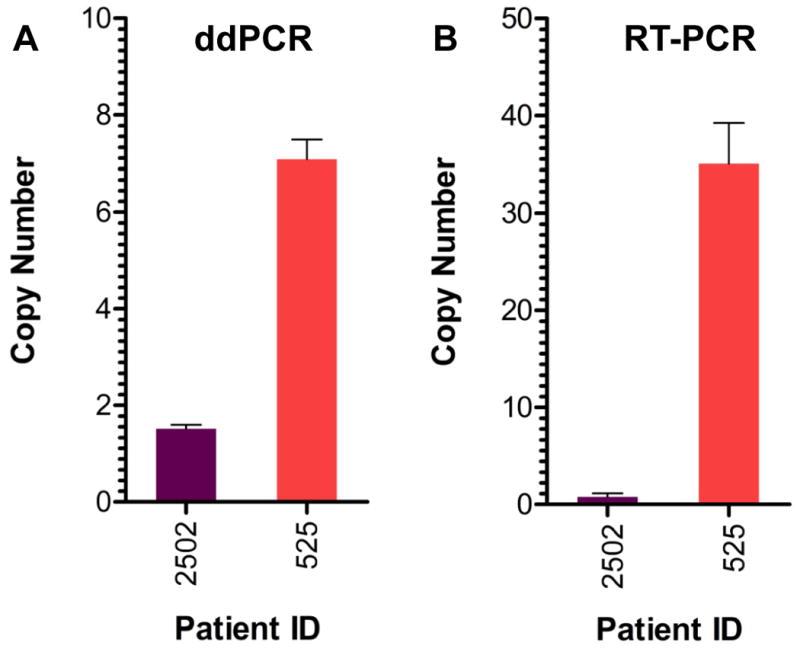
Figure 3.

Comparison of ddPCR versus real-time PCR for measuring FGFR2 copy number in FFPE tissue.
FGFR2 copy number was measured in two different patient samples by ddPCR (panel A) and real-time PCR (panel B). The FFPE sample from Patient 2502 (purple bars) represents normal gastric tissue. The FFPE sample from Patient 525 (red bars) is a gastric adenocarcinoma sample. Data are plotted as copy number per diploid genome.
