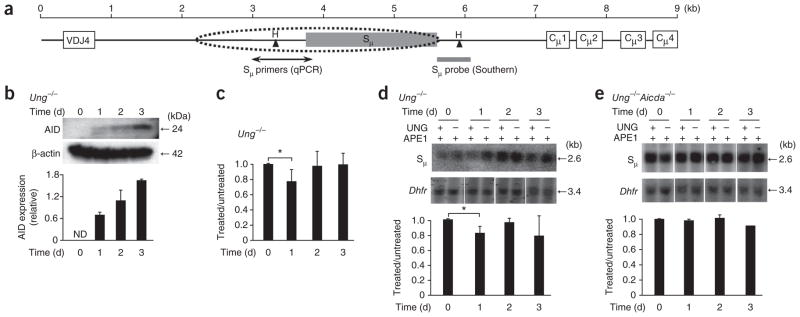
Figure 4.

Uracil residues in the Sμ region after ex vivo stimulation of mouse splenic B cells with LPS and IL-4. (a) Map of the Sμ region. Dotted oval indicates the scope of SHM; Sμ primers amplify 858 bp by quantitative PCR; gray bar indicates position of the probe to hybridize a 2.6-kb fragment generated by digestion with HindIII (H). (b) Immunoblot analysis (top) of AID expression in Ung−/− mouse splenic B cells treated with LPS and IL-4. Below, quantification of band intensity, presented relative to that of β-actin. Data are representative of three experiments (error bars, s.e.m.). (c) Quantitative PCR analysis of the amplification of Sμ in intact DNA from Ung−/− cells (presented as in Fig. 3b). *P = 0.02 (two-tailed t-test). Data are representative of four experiments (error bars, s.e.m.). (d,e) Southern blot analysis (top) of intact DNA isolated from Ung−/− cells (d) or Ung−/−Aicda−/− cells (e), digested with HindIII, treated with APE1 with or without UNG, separated by electrophoresis through in alkaline agarose gels and blotted with probes to Sμ and Dhfr. Below, quantification of uracil in treated samples, standardized to Dhfr results and presented relative to that of untreated samples. *P = 0.02 (two-tailed t-test). Data are from three independent experiments (error bars, s.e.m.).
