Fig. 4.
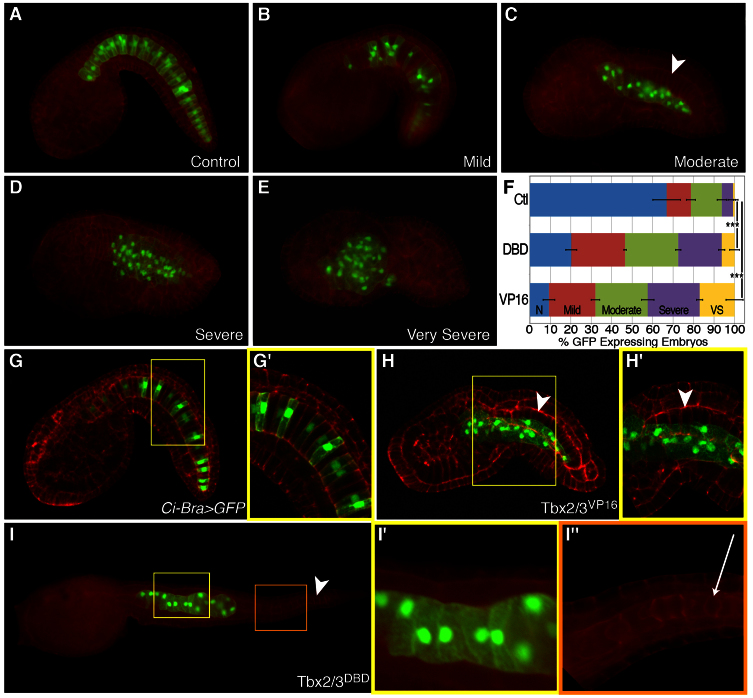
Perturbation of Ci-Tbx2/3 function causes defects in notochord morphogenesis. (A) Ci-Bra>GFP control embryo. (B-E) Classification of notochord intercalation defects observed in embryos electroporated with either Ci-Bra>Tbx2/3DBD::GFP or Ci-Bra>Tbx2/3VP16::GFP. (F) Quantification of phenotypic categories displayed in A-E. n=1581 for control (Ctl), n=586 for DBD and n=309 for VP16; N, normal; VS, very severe. ***P<0.001 compared with controls. (G-H′) Confocal z-stacks of Ci-Bra>GFP controls (G,G′) and Ci-Bra>Tbx2/3VP16::GFP (H,H′) stage-matched embryos. (I-I″) Larva (~17.5 hpf) expressing Ci-Bra>Tbx2/3DBD::GFP. (G′,H′,I′,I″) Higher magnification views of the areas boxed in yellow or orange in G, H and I, respectively. White arrowheads indicate non-transgenic notochord cells, whereas a white arrow (I″) indicates a lumen between non-transgenic cells. All embryos were counterstained with rhodamine-phalloidin (red).

