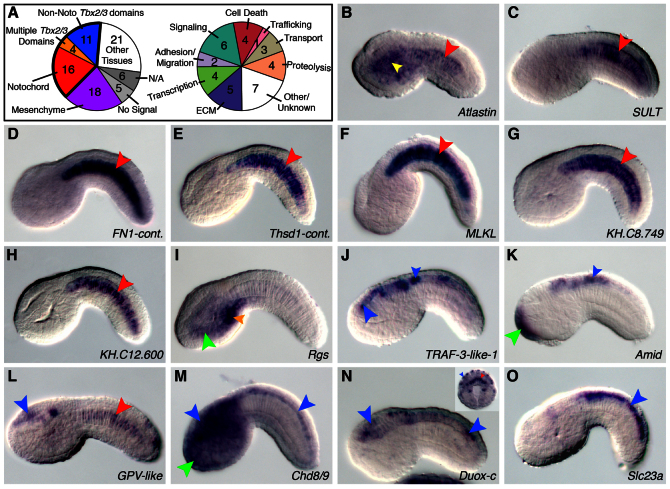
Fig. 5.
Expression patterns of candidate Ci-Tbx2/3 targets identified via microarray screen. (A) Left: pie chart summarizing the expression patterns of 81 potential Ci-Tbx2/3 target genes. The ‘multiple Tbx2/3 domains’ category represents those genes found in the notochord and at least one non-notochord Ci-Tbx2/3 expression territory. Right: pie chart depicting putative functions for the 31 targets expressed in Ci-Tbx2/3 expression domains (outlined in bold on the left). Some genes are present in multiple categories. (B-O) Whole-mount in situ hybridization on early to late tailbud embryos for the genes listed in the lower right corner of each panel. The inset in N shows a 110-cell stage embryo probed for Duox-c expression. Stained territories are denoted by colored arrowheads as follows: red, notochord; orange, muscle; blue, CNS; green, epidermis; yellow, endoderm. Larger arrowheads signal expression in domains matching that of Ci-Tbx2/3, whereas smaller arrowheads indicate expression in other areas. Cont., containing; N/A, not assayed.

