Fig. 7.
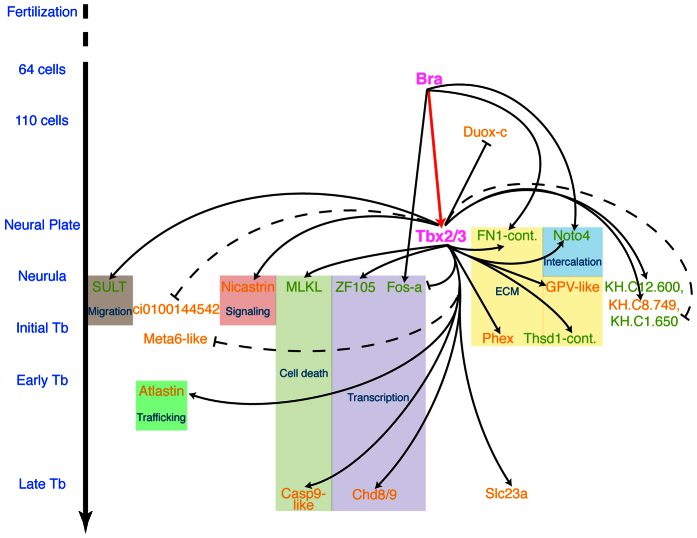
The notochord gene network downstream of Ci-Bra and Ci-Tbx2/3. The onset of notochord expression of Ci-Bra, Ci-Tbx2/3 and some of the newly identified Ci-Tbx2/3 target genes are plotted against the timeline of Ciona developmental stages on the left. Arrows indicate activation of gene expression, whereas bars signify negative regulation. Broken lines are used for those genes that retain weak notochord expression, possibly owing to incomplete repression by Ci-Tbx2/3. Colored boxes encompass genes with similar putative functions. Gene names in green indicate Ci-Tbx2/3-regulated targets that have also been identified as targets of Ci-Bra in previous studies. Names in orange are used for genes that are Ci-Tbx2/3-specific targets. Cont., containing; ECM, extracellular matrix.

