
Figure 1. TCR Tg CD4 T cells strongly respond to Sm-p40 with a proinflammatory cytokine profile.
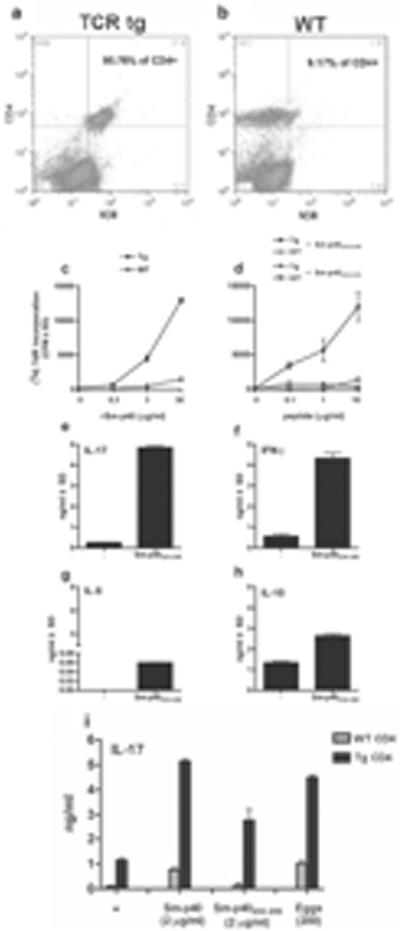
Bulk spleen cells from three to five (a) TCR Tg CBA or (b) WT mice were stained with anti-CD4 and anti-Vβ8 mAbs and analyzed by flow cytometry. SplenicCD4 T cells from TCR Tg and WT CBA were stimulated with (c) Sm-p40 egg Ag, or (d) peptides thereof, in the presence of irradiated syngeneic WT splenocytes for 72h. Cells were pulsed with (3H) thymidine for the last 18h of culture and incorporation was measured by scintillation spectroscopy. Bulk spleen cells from TCR Tg or WT CBA were cultured for 72h in the presence or absence of 2μg/ml of peptide Sm-p40234–246, and (e) IL-17, (f) IFN-γ,(g) IL-5and (h) IL-10levels in culture supernatants were measured by ELISA. (i) DCs from WT CBA mice plus TCR Tg or WT CBA CD4 T cells were stimulated with Sm-p40 Ag, peptide Sm-p40234–246, or 200 liveschistosome eggs for 48h, and IL-17 levels in culture supernatants were measured by ELISA. Cytokine levels are expressed as means of triplicate ELISA determinations ± SD. Data are from one representative experiment of three.