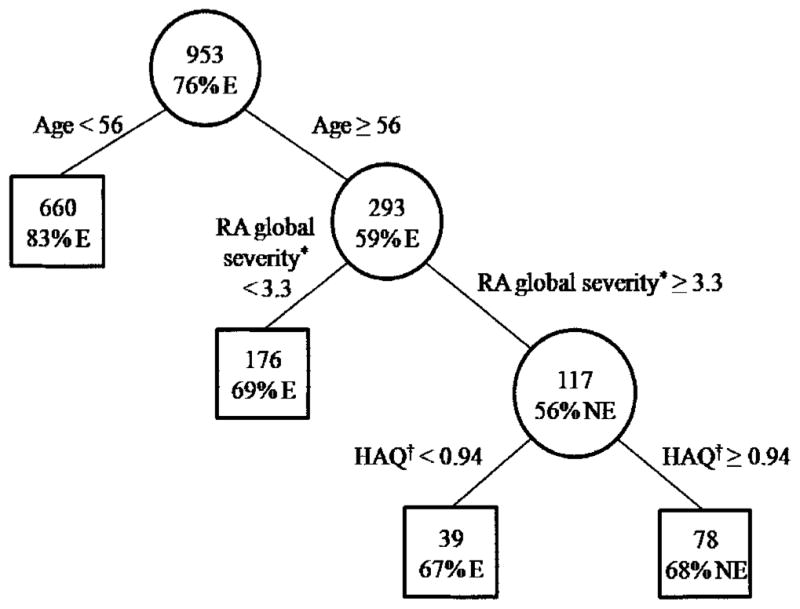
Figure 2.

Classification tree of employment status at followup. Boxes are final nodes. The top number in each circle or box is the number of subjects. The percentage is the dominant proportion. * Rheumatoid arthritis (RA) global severity = status considering all RA effects; higher score = poorer status. † Health Assessment Questionnaire (HAQ) measure of functional limitation: higher score = greater limitation. E = employed; NE = not employed.
