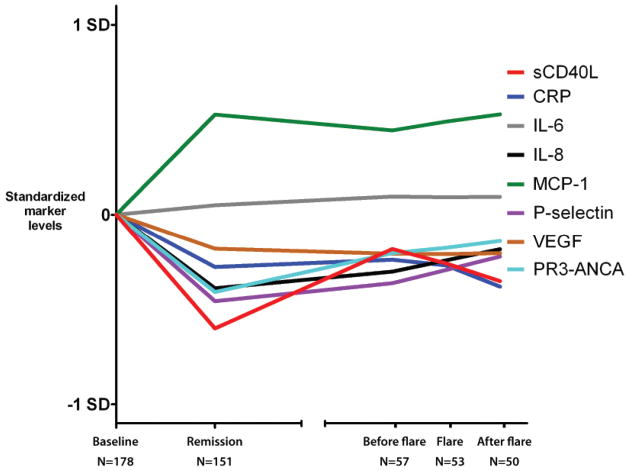
Figure 1.
Longitudinal changes of marker levels. Nonparametric smoothing of marker levels at several timepoints in the study. X axis represents different timepoints, and the Y axis standardized marker levels after subtraction of the baseline value (all baseline values set to zero). Broken X axis represents that flares did not occur at the same times for all study subjects.

