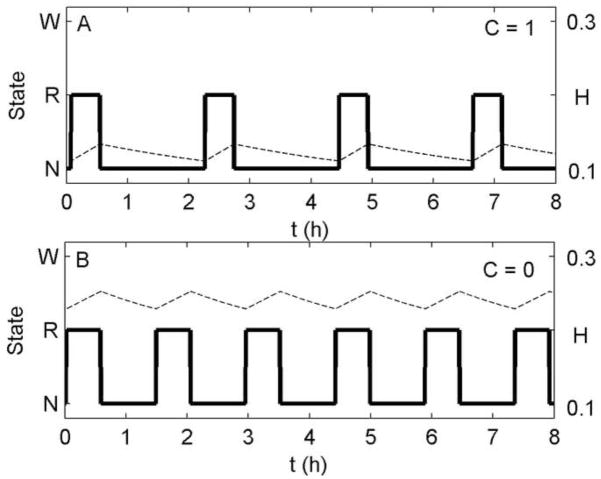
Figure 2.
Ultradian oscillations of NREM sleep and REM sleep at a fixed circadian phase during 8 h of enforced Sleep (x = 0) using the homeostatic mechanism. The y-axis shows arousal state, W = Wake, R = REM sleep, N = NREM sleep. Simulations are at (A) the circadian wakefulness maximum, C = 1, and (B) the circadian wakefulness minimum, C = 0. Plotted are arousal state (thick solid line) and homeostatic drive (dashed line).

