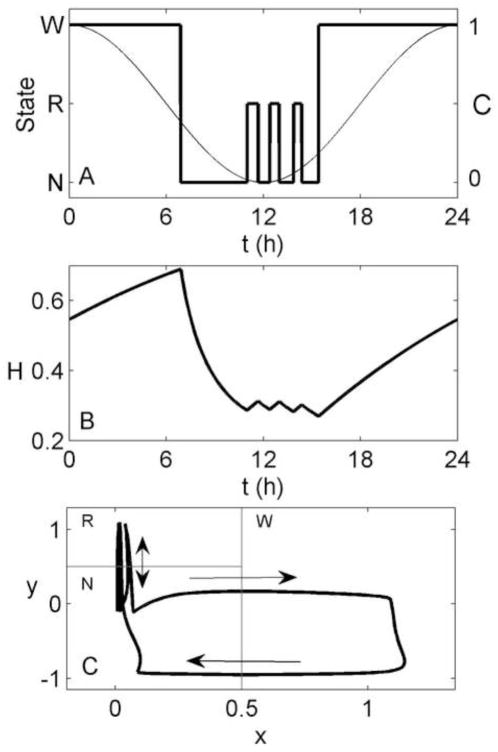
Figure 4.
Simulation of 24 h of spontaneous sleep/wake, generated using the homeostatic mechanism. (A) Arousal state (thick line), and the circadian drive (thin line) as functions of time. (B) Homeostatic drive (H) as a function of time. (C) Path of the system in phase space (thick line), with arrows indicating the direction of motion. Thin gray lines indicate the demarcations between arousal states, as per Figure 1.

