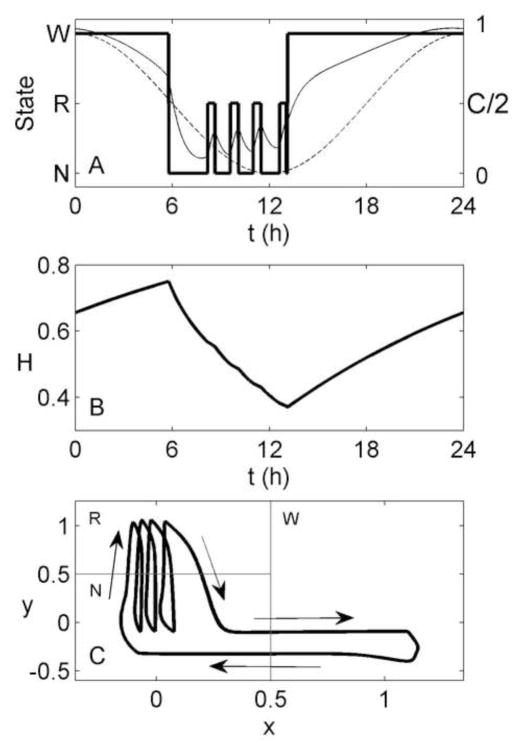
Figure 6.
Simulation of 24 h of spontaneous sleep/wake, generated using the circadian mechanism. (A) Arousal state (thick line) as a function of time, shown with the circadian drive, C/2 (thin solid line), which varies with arousal state, and the sinusoidal component, C − Z (thin dashed line). The latter is not divided by 2 so that they can be seen on the same axes. (B) Homeostatic drive as a function of time. (C) Path of the system in phase space (thick line), with arrows indicating the direction of motion. Thin gray lines indicate the demarcations between arousal states, as per Figure 1.

