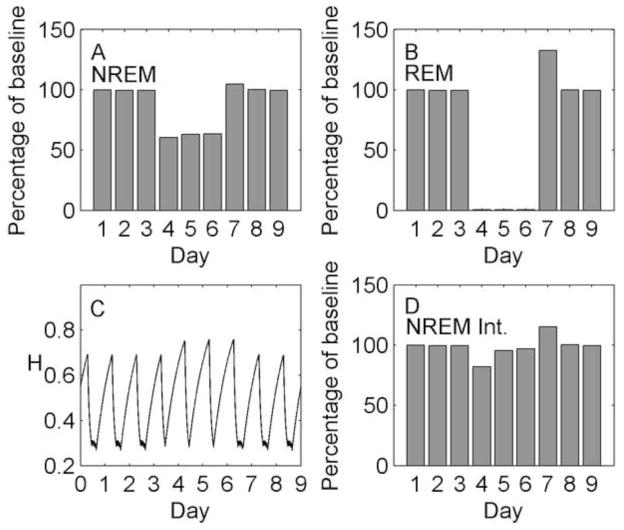
Figure 9.
Simulation of selective REM sleep deprivation and recovery using the homeostatic mechanism. Days 1–3 are baseline, days 4–6 are selective REM sleep deprivation, and days 7–9 are recovery. (A) Total NREM sleep duration per day as a percentage of baseline. (B) Total REM sleep duration per day as a percentage of baseline. (C) Homeostatic drive H as a continuous function of time. (D) Total homeostatic dissipation per day (integrated with respect to time) as a percentage of baseline, used as a marker of NREM sleep intensity.

