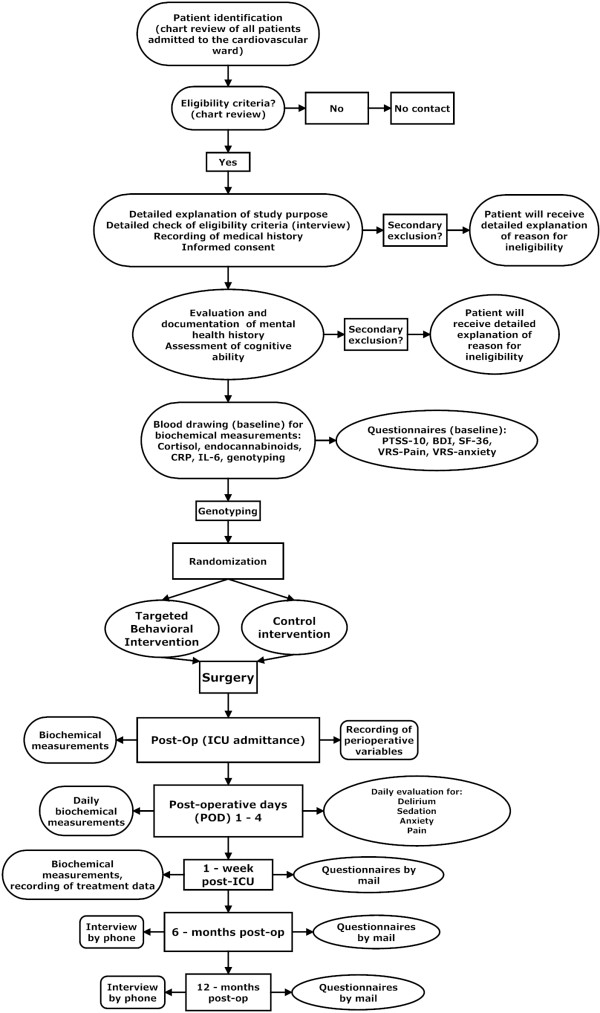
Figure 3.
Flow chart showing the sequence of events and key points of decision making during the proposed study. Rounded rectangles indicate tasks to be performed by medical personal (for example, the study physicians). Ovals represent the responsibilities of a study psychologist and his or her team.

