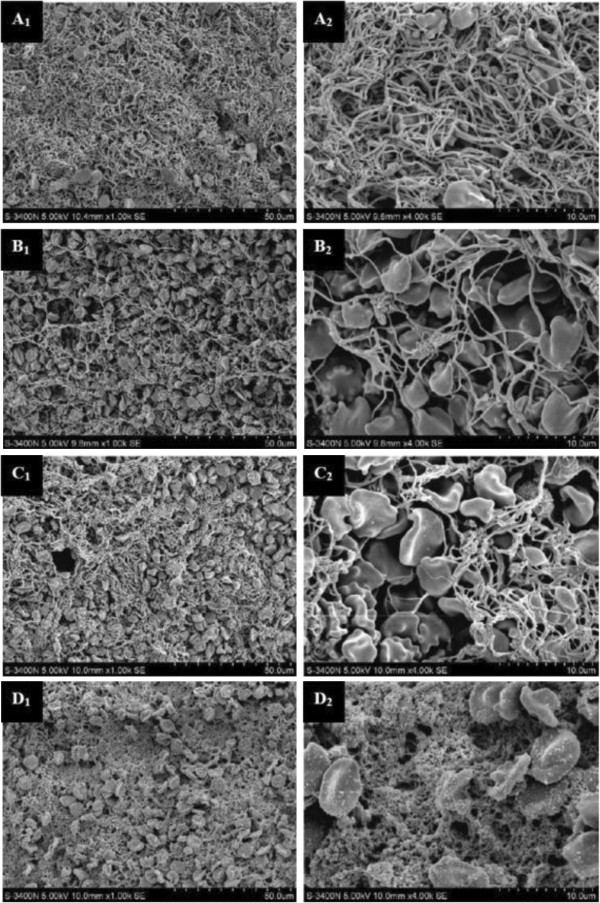
Figure 9.

After treatment, the thrombi were observed under the electron microscope. A1, A2: control group; B1, B2: uPA group; C1, C2, C3, C4: uPA + US group; A1, B1, C1, C3 were amplified by 1000 times; A2, B2, C2, C4 were amplified by 4000 times [64].
