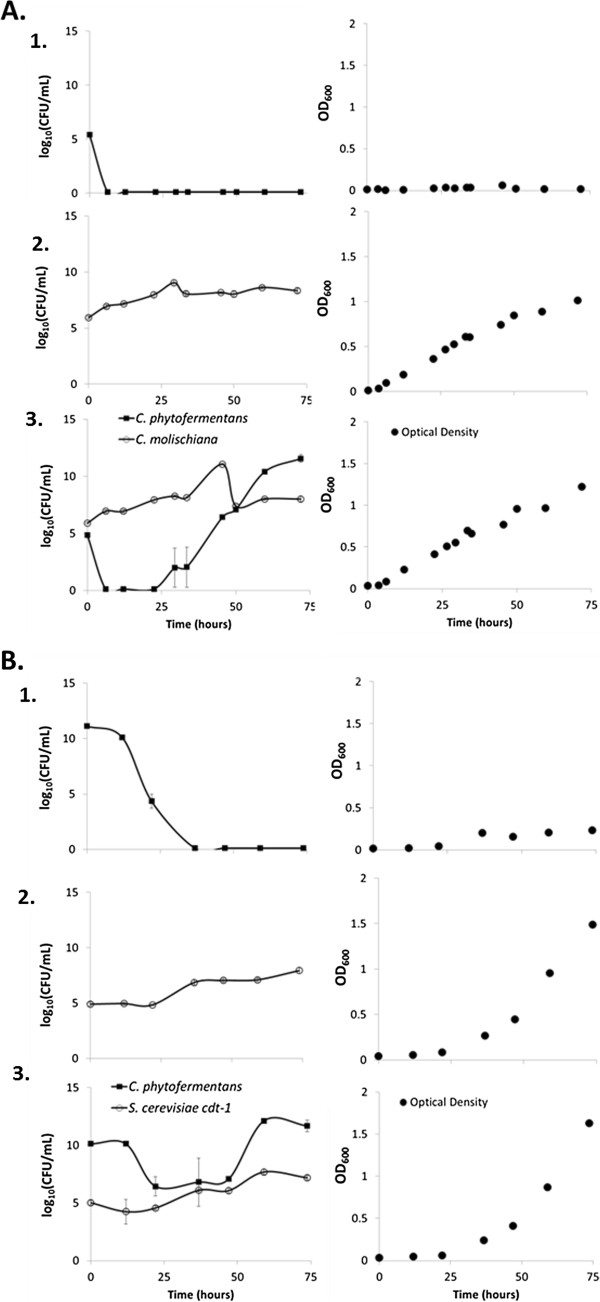
Figure 1.
Semi-aerobic mono- and co-culture growth on cellobiose.C. phytofermentans mono-culture (A.1 and B.1), C. molischiana mono-culture (A.2),C. phytofermentans/C. molischiana co-culture (A.3), S. cerevisiae cdt-1 mono-culture (B.2) and C. phytofermentans/S. cerevisiae cdt-1 co-culture (B.3) viable cell counts (left) and optical densities (right) in GS2 cellobiose fermentations. Results are representative of at least two independent experiments. Error bars are the standard deviation among drops for colony counting.

