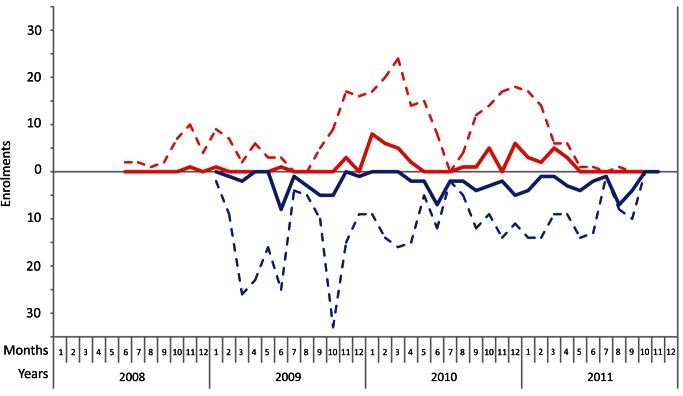
Figure 2. Monthly enrollments during the course of the study.
The enrollments for the symptomatic group are represented above by a red dotted line. The enrollments for the asymptomatic group are represented below by a blue dotted line. The solid lines represent the absolute number of M. pneumoniae–positive participants. Enrollment for the asymptomatic group started in January 2009.

